This guide covers how to get started with Develocity, with topics such as strategies for incrementally introducing Build Scan® and Build Cache usage, and key Build Scan features for improving your development productivity.
Develocity provides two complementary functions: Build Scan and the Build Cache. A Build Scan is a permanent and shareable record of an executed build that allows collaborative troubleshooting and optimization. The Build Cache makes builds faster by allowing reuse of the outputs of builds.
Installation
This guide does not cover installation of Develocity. Please consult one of the following installation manuals for help with installation:
The remainder of this guide will assume that your installation has a public hostname of develocity.example.com and has enabled HTTPS.
Quickstart
To get the most out of this guide, we recommend trying it out for yourself. If you don’t have a project that you can easily use to this end, consider using the quickstart project.
Build Scan
Build Scans are a significant innovation in software build tooling. Having centralized and shareable records providing fine-grained details and insights of all builds, including local development builds, enables new levels of collaborative debugging and optimization.
Applying the plugin
| The configuration examples in this section assume you are using Develocity Gradle plugin 3.17 or later. For older versions, please refer to the (Legacy) Gradle Enterprise Gradle Plugin User Manual. |
Gradle 6.x and later
The com.gradle.develocity plugin must be applied in the settings file of the build.
plugins {
    id("com.gradle.develocity") version("4.2.2")
}

develocity {
    // configuration
}plugins {
id "com.gradle.develocity" version "4.2.2"
}
develocity {
// configuration
}The plugin is configured via the develocity extension available in the settings script, which is also available via the root project in project build scripts. The same instance is used for the settings extension and root project extension.
Gradle 5.x
The com.gradle.develocity plugin must be applied to the root project of the build.
plugins {
     id("com.gradle.develocity").version("4.2.2")
}

develocity {
    // configuration
}plugins {
id "com.gradle.develocity" version "4.2.2"
}
develocity {
// configuration
}The plugin is configured via the develocity extension of the root project in project build scripts.
|
You may encounter a warning about an untrusted certificate every time you try to publish a Build Scan to an HTTPS URL. The ideal solution is for someone to add a valid SSL certificate to the Develocity instance, but we recognise that you may not be able to do that. In which case, set the Disabling SSL certificate checks
Disabling SSL certificate checks
This is a convenient workaround, but you shouldn’t use it as a long-term solution. |
Given the above configuration, you can now run your build with --scan to produce a Build Scan. As the build completes, the last lines of output will be similar to:
Publishing Build Scan to Develocity...
https://develocity.example.com/s/3z475bz247h5g
Follow that link to view your Build Scan.
Build Scan highlights
This section calls out a subset of the things that you can do with Build Scans.
Share console logs
Build Scans include the console output produced by the build. Many tools used by the build, such as compilers, often write diagnostic information to the console log.
Use the left navigation menu to visit the Console log section.
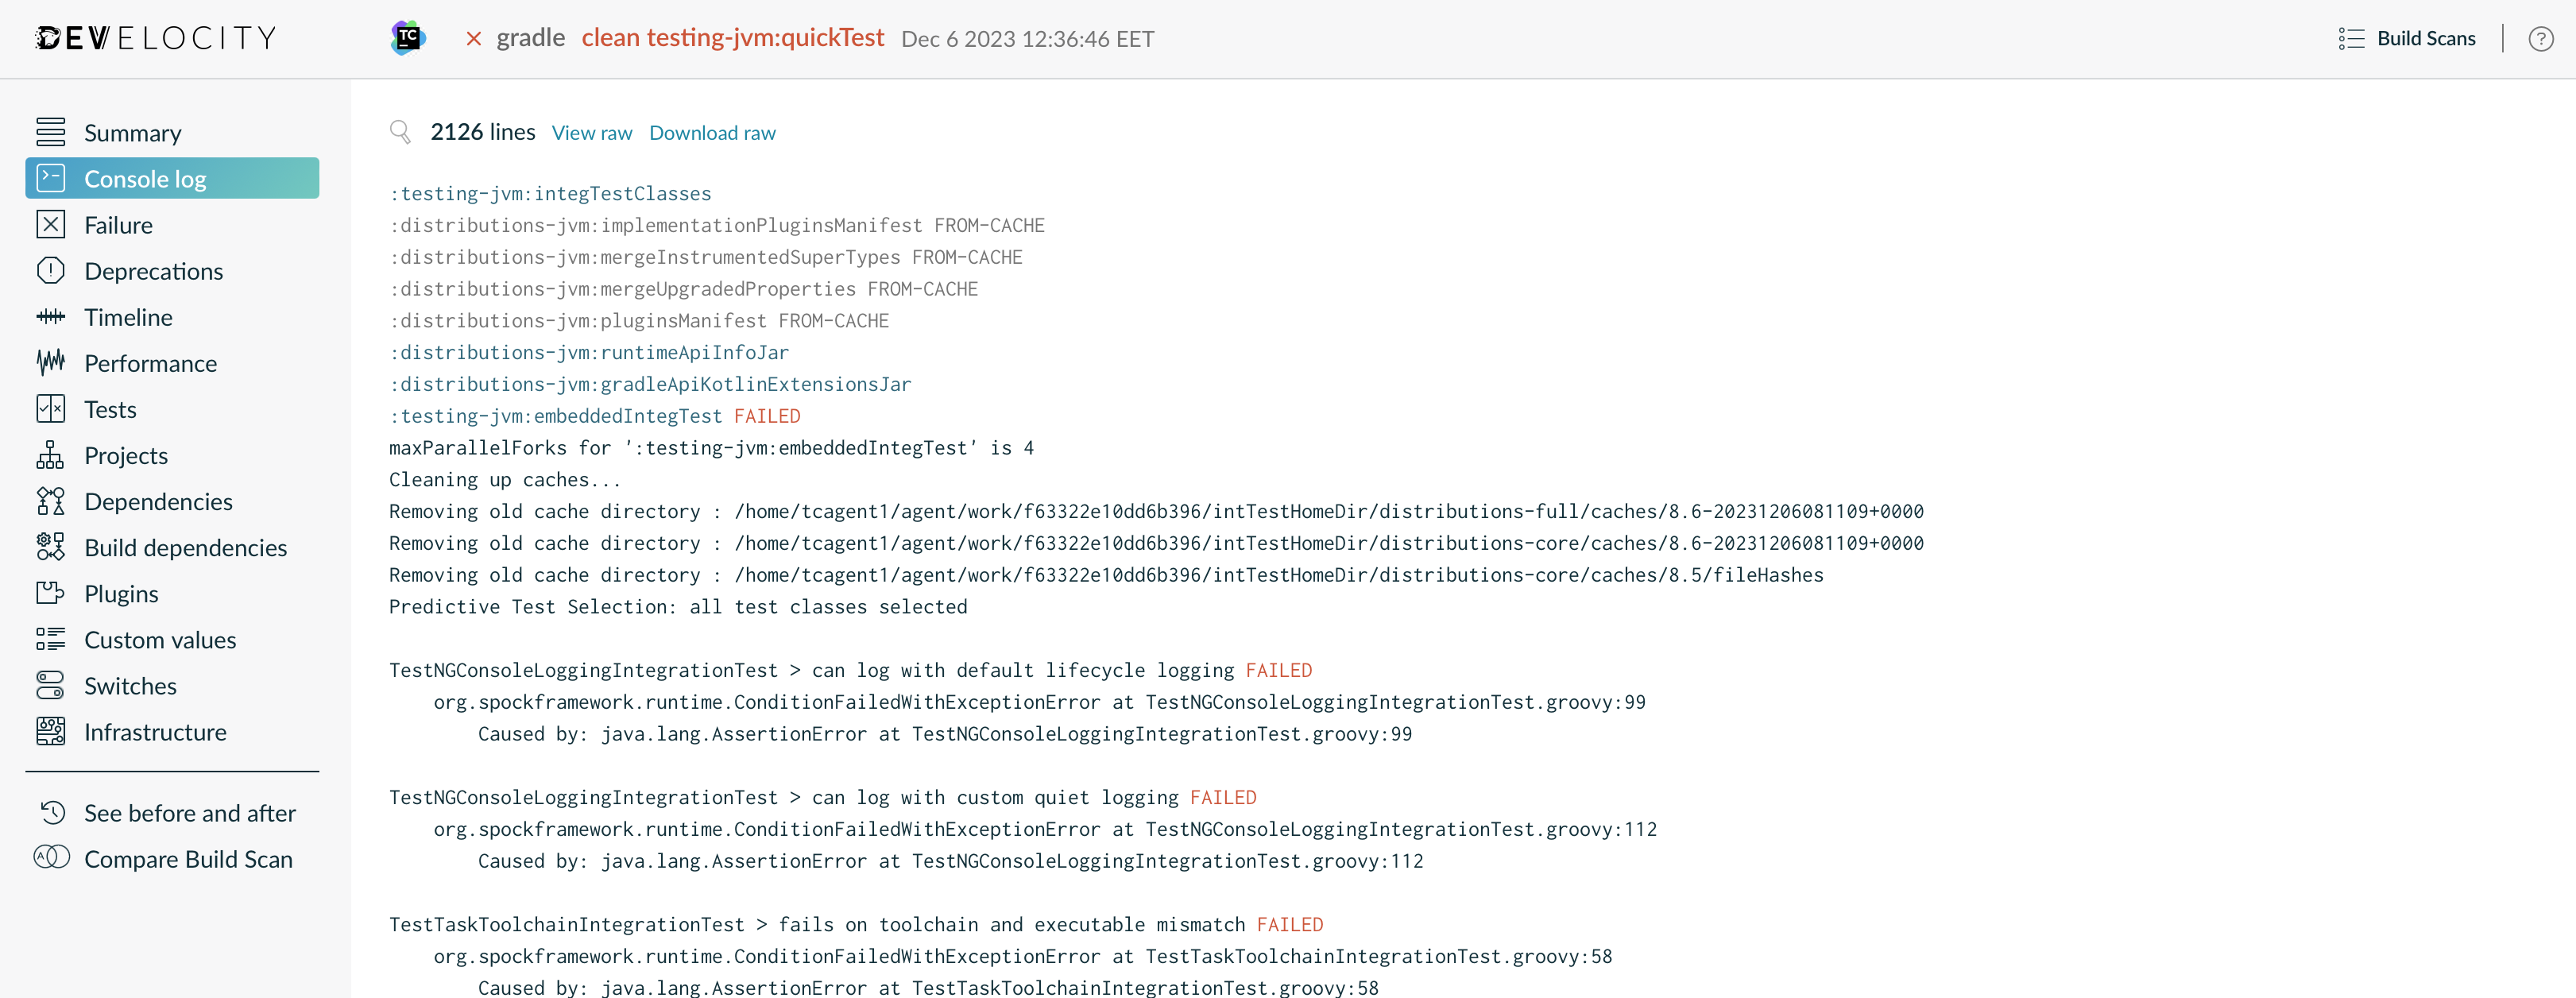
Click on any line to highlight it or shift-click two different lines to highlight a block of lines. Note that the browser’s current location has been updated. By sharing that URL with a colleague, you can direct them to the exact console output that you wish them to see.
Many aspects of Build Scans are directly linkable in order to facilitate sharing and collaboration.
Find and view any Build Scan
Search through all the published Build Scans by going to https://develocity.example.com.
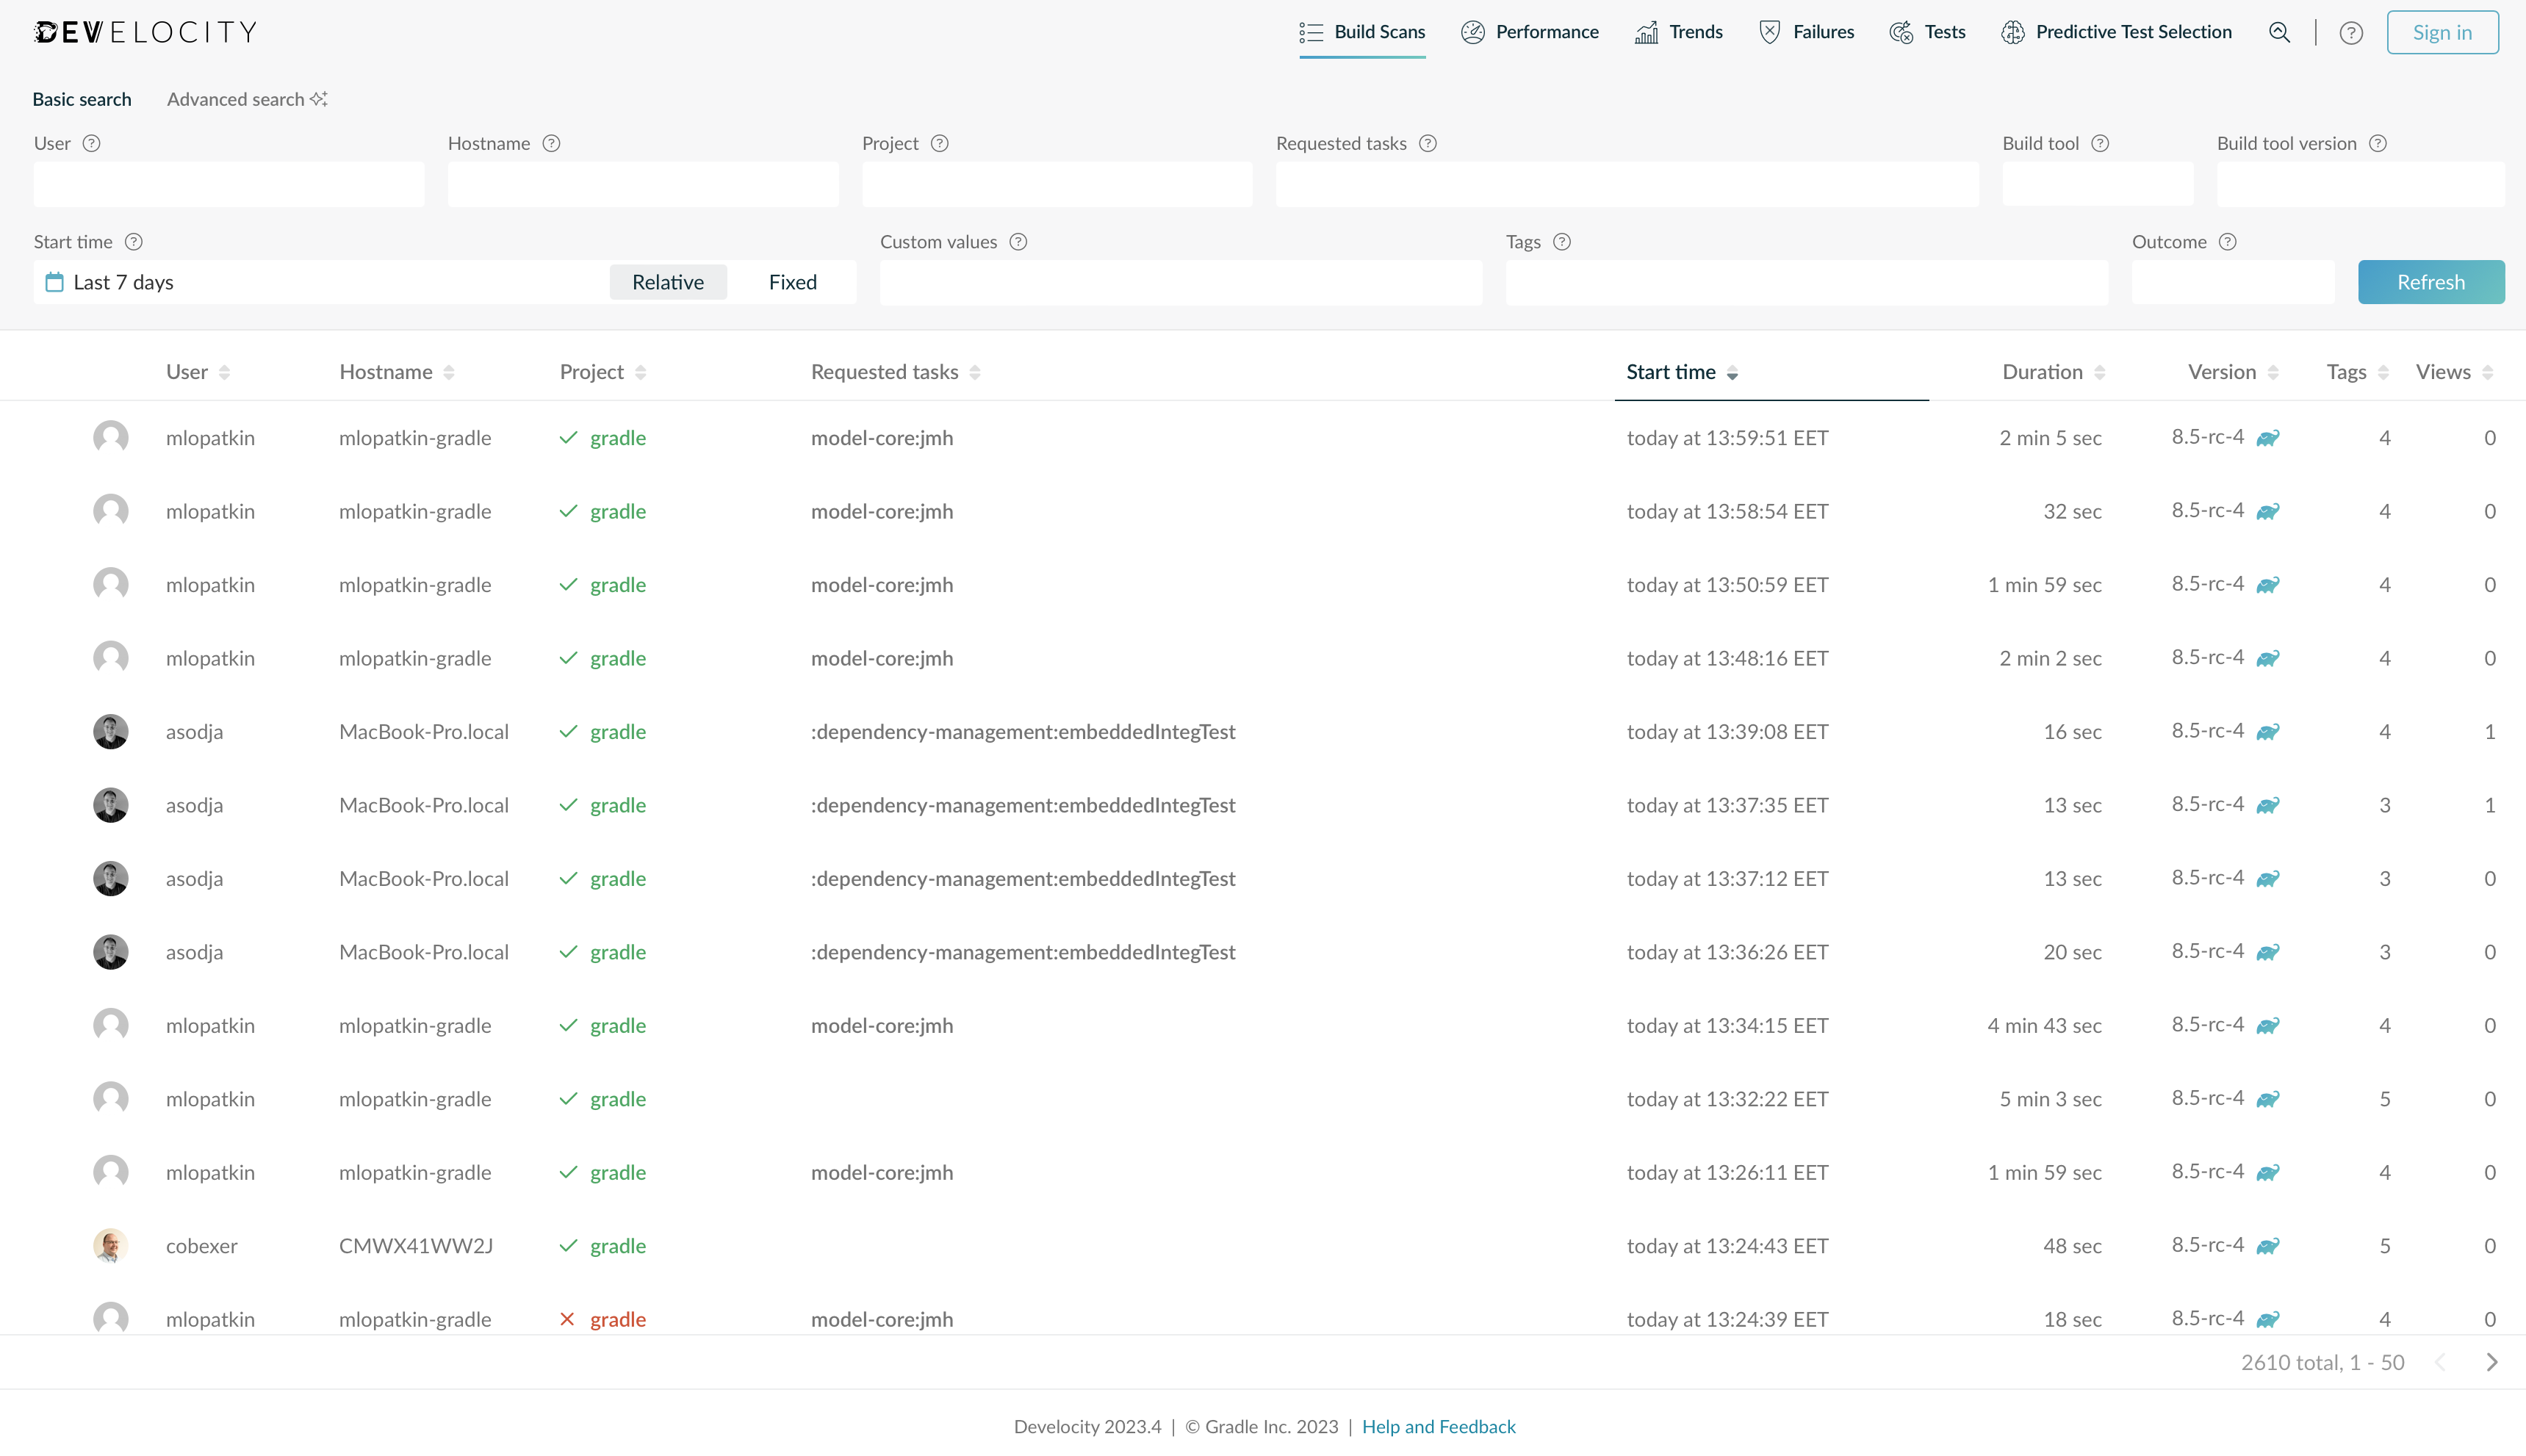
This view allows searching by various criteria, including root project name, user name, build outcome, build start time and more. By default, the list is sorted to show the most recent scans first.
Beyond looking for a particular Build Scan, the listing can provide new insights into the actual builds being run at your organization and by your colleagues. You may find occurrences of previously unknown errors with your build, or that the build is taking longer in certain cases than you expected, or that certain build users are executing more tasks than they need to and are therefore subjecting themselves to more build time than they need to, and other previously unknown behaviors.
Inspect test results
If your build executed tests, then their results will be included in your Build Scan. Use the left navigation menu to visit the Tests section.
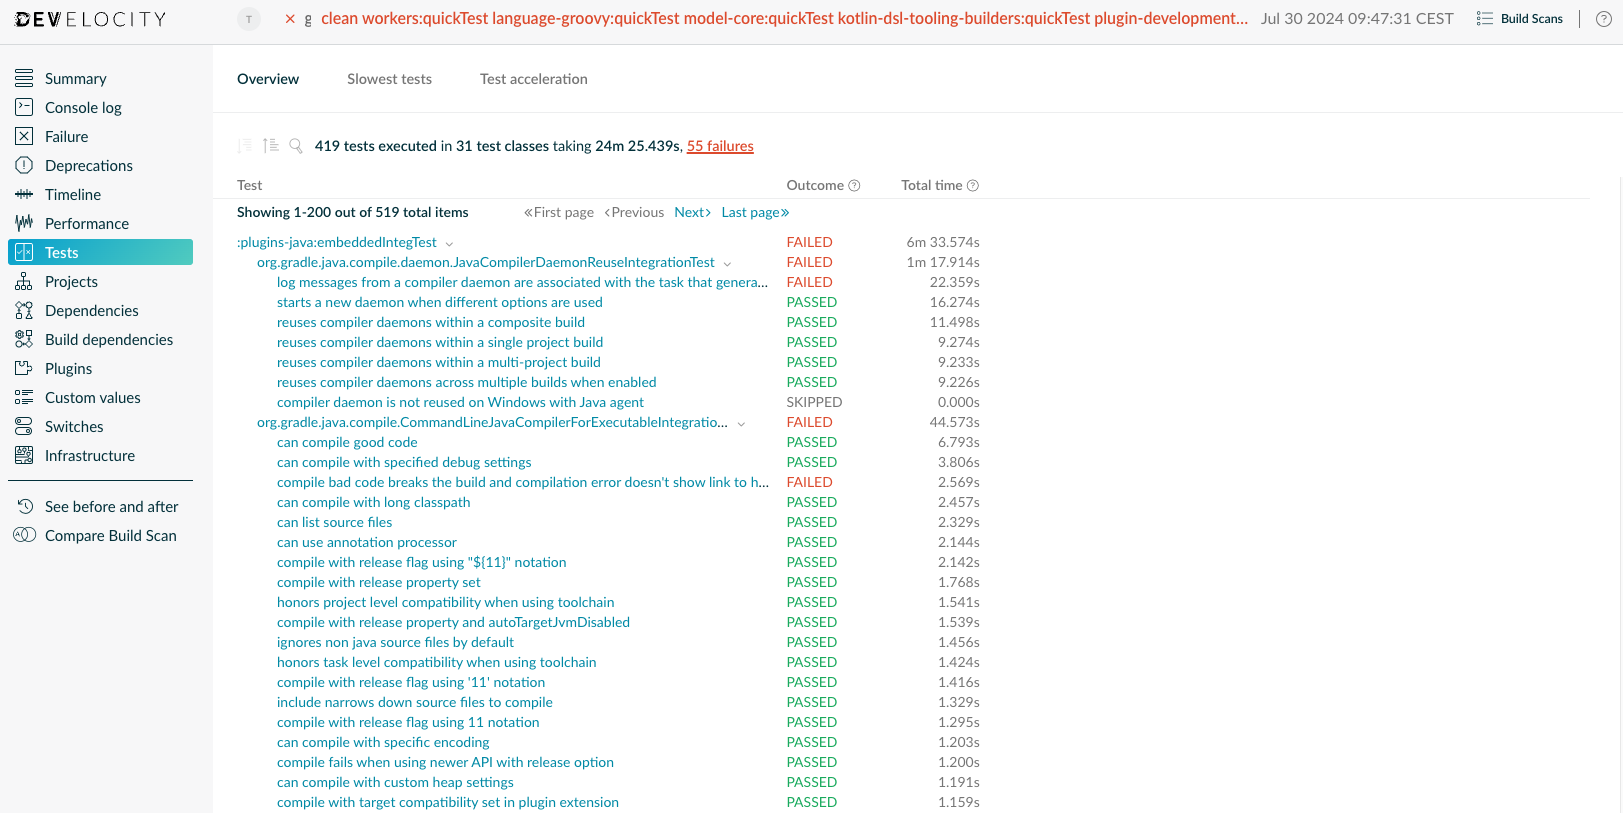
This section shows the results of all the tests that ran during your build, along with their outcome and durations. The results are broken down by task, test suite and test case. Select any test suite or test case to see details about each of their individual executions, in case of test retry. The total time is available for task, test suites and test cases. Generally, it corresponds to the wall clock time that an execution lasted. Under some circumstances, some durations may be missing. Please refer to Viewing test results for more details.
Only test results from Gradle’s built-in Test task are currently visualized. |
Analyze build performance
A key benefit of Build Scans are the various insights they provide into build performance. Many builds provide different functions for different people and will perform differently on different machines. Having deep performance insights available for every build enables optimizing all corners of the build, for all users.
Use the left navigation menu to visit the Performance section.
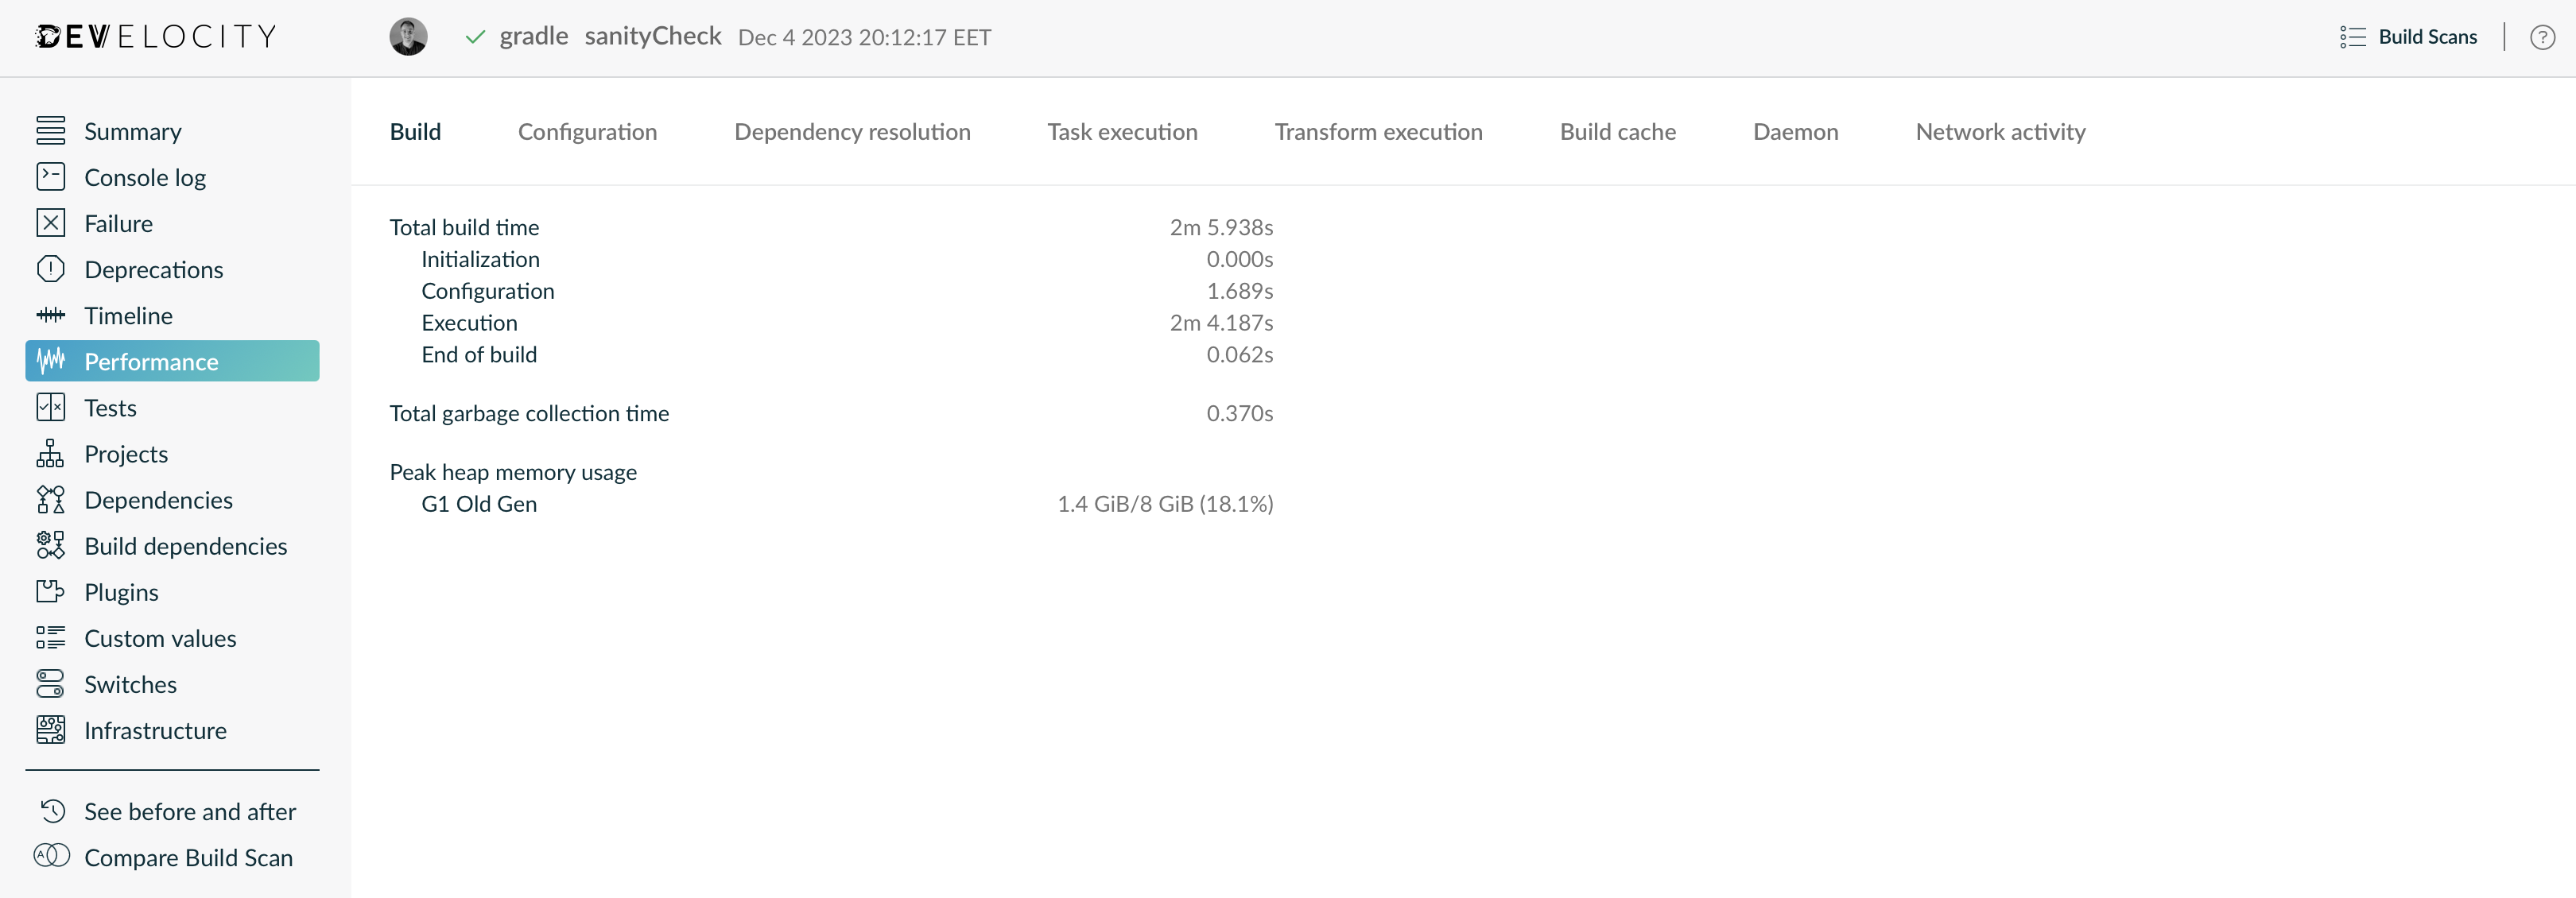
The different tabs focus on different aspects of performance.
The Build tab provides a high level build time breakdown and memory information. It also shows several graphs about resource usage (CPU, memory, disk and network traffic), when using Develocity Gradle plugin 3.18 or later.
The Configuration tab provides an interactive breakdown of the time spent configuring the projects participating in the build, highlighting the slowest scripts, plugins and lifecycle callbacks used during the build. The slowest scripts, plugins and lifecycle callbacks are typically the best candidates for optimizing in order to make your build faster.
The Dependency resolution tab provides insights into how much time was spent during dependency resolution. It also shows which dependencies have been resolved during configuration time or execution time.
The Task execution tab provides a concise breakdown of the tasks that participated in the build, grouped by outcome. This provides a high level view of task execution and can be used to understand incremental build and build caching coverage for a particular build. The dedicated Timeline section (available via the left navigation menu) provides an alternative view, visualizing the task execution as a timeline. This view provides more detail on individual tasks (click the task name in the list), and more clearly shows the parallel utilization of your build.
The Build Cache tab displays the Build Cache configuration for the build (e.g. whether a remote Build Cache was used), and lists the individual Build Cache operations and how long they took. This is particularly useful for analyzing the performance of the remote Build Cache connection and identifying whether a slow connection is having adverse effects on the build time.
The Daemon tab displays information about the Gradle daemon, e.g. age of the daemon used to run the build.
The Network activity tab lists the network requests made during the build and can be used to identify slow dependency repositories or particularly troublesome requests.
Optimize cacheability
For a task to be cacheable, its implementation must meet certain requirements along with its configuration. Build Scans make it easy to see which tasks are cacheable, and why those that aren’t, aren’t.
The Timeline section allows filtering of tasks via certain criteria, one of which is cacheability.
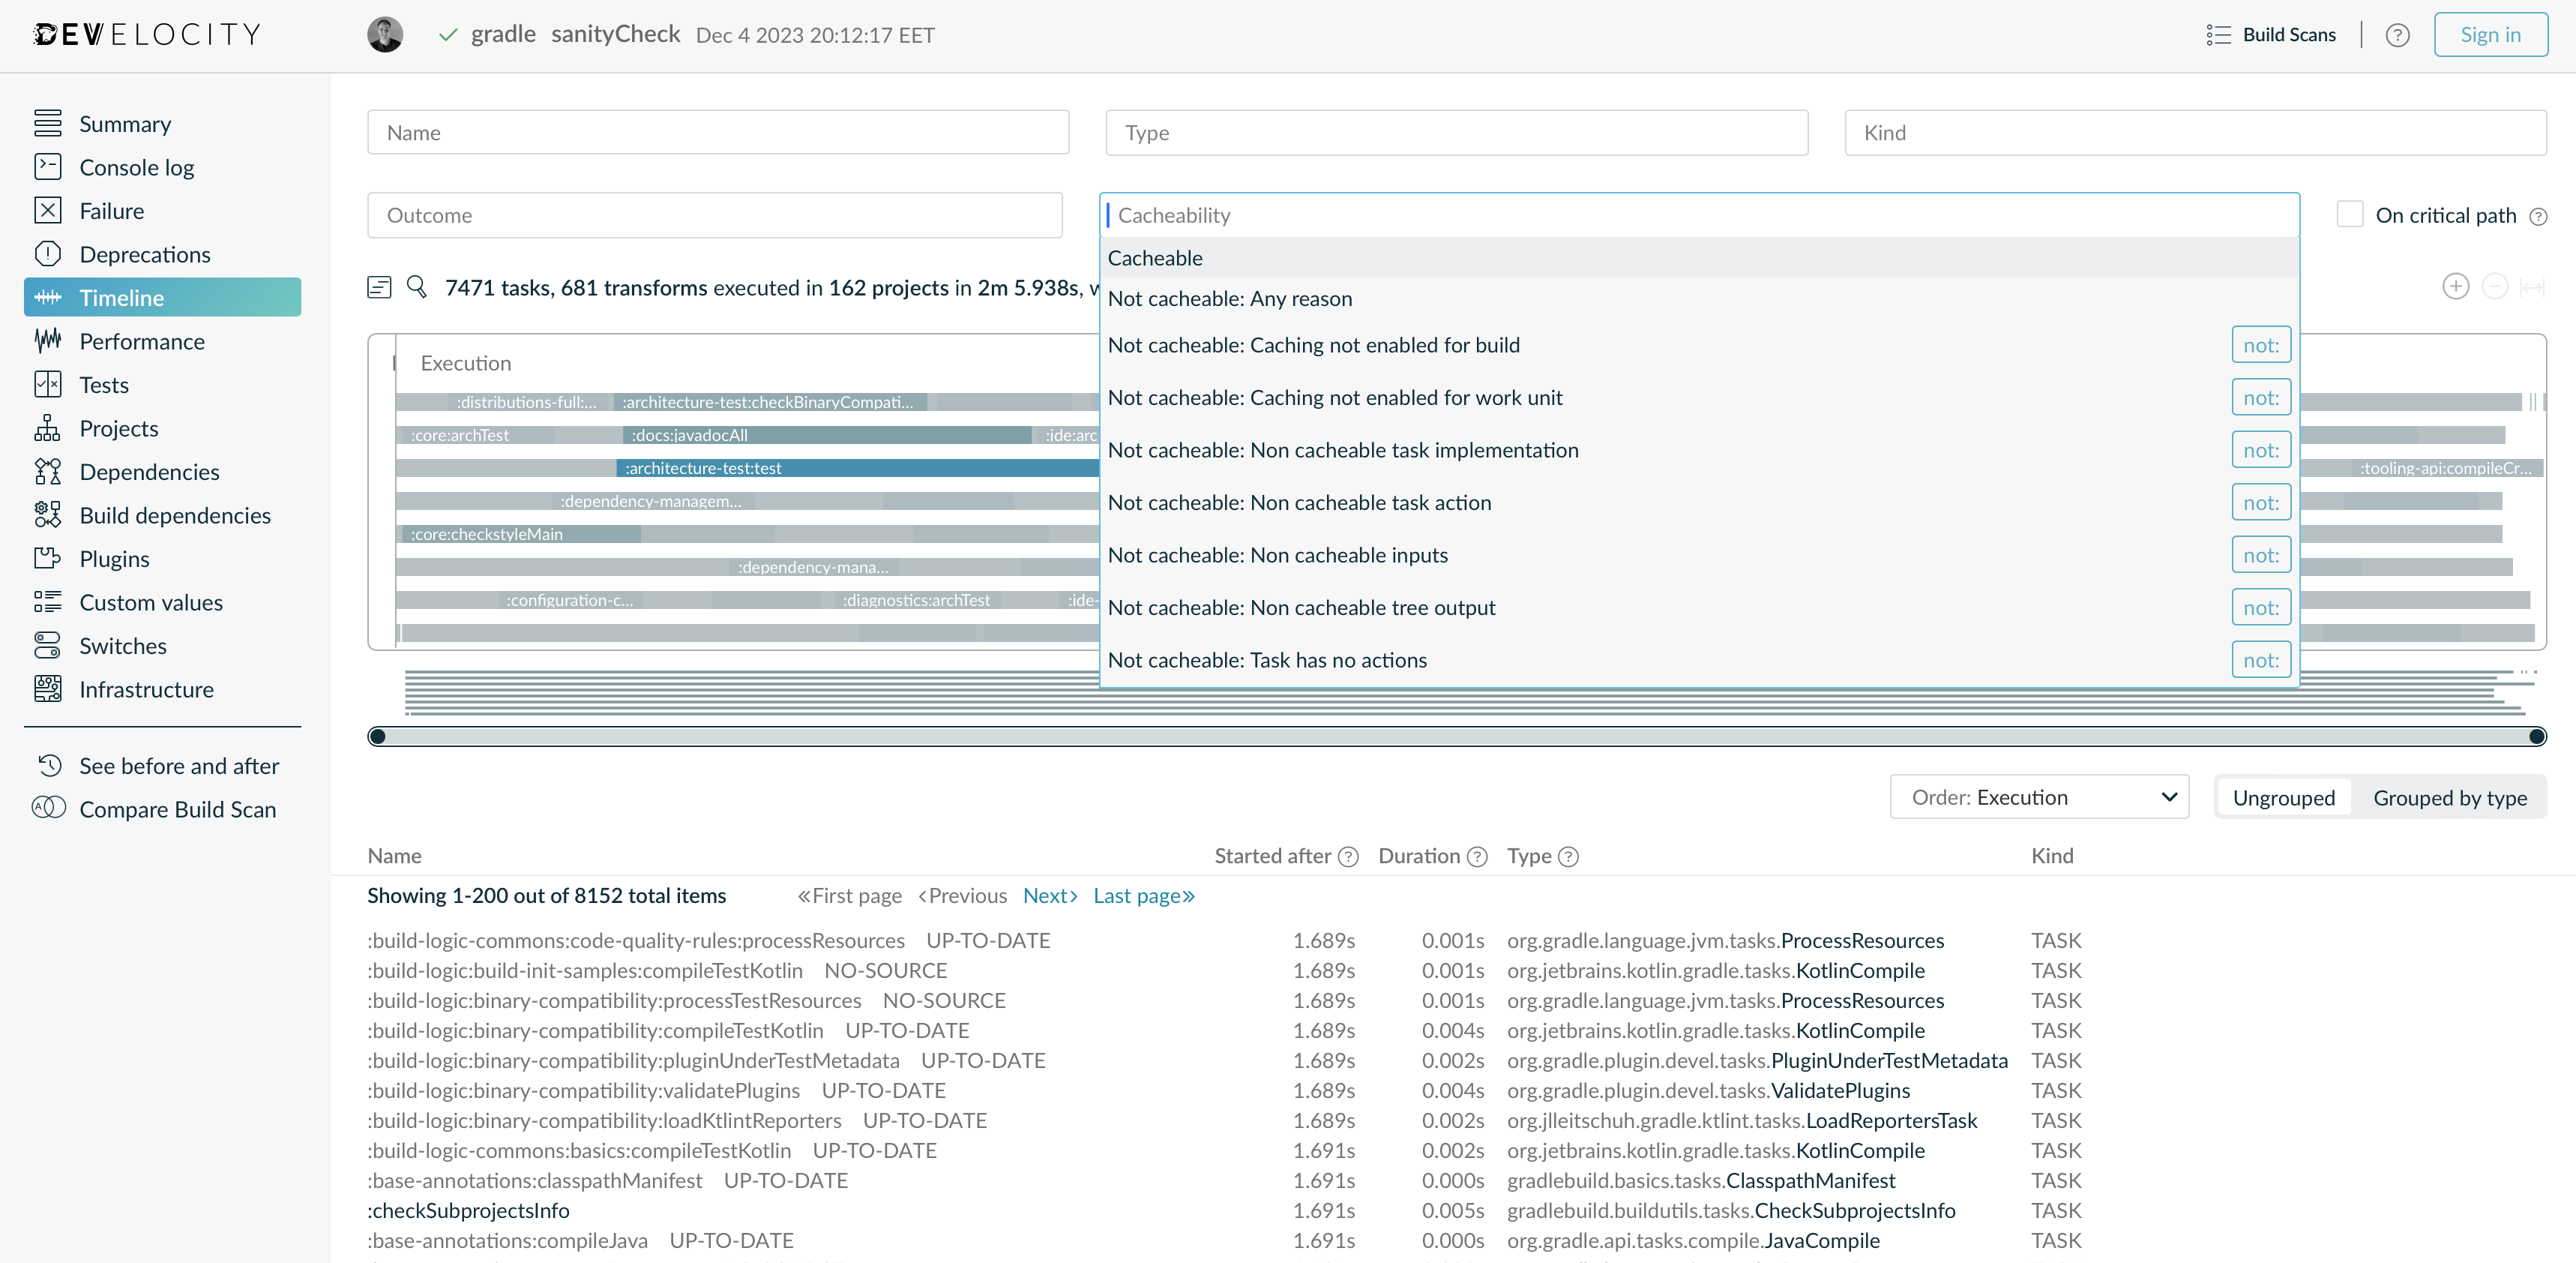
This is useful when starting with build caching, and as your projects change and evolve, to ensure that you are getting the most out of the Build Cache.
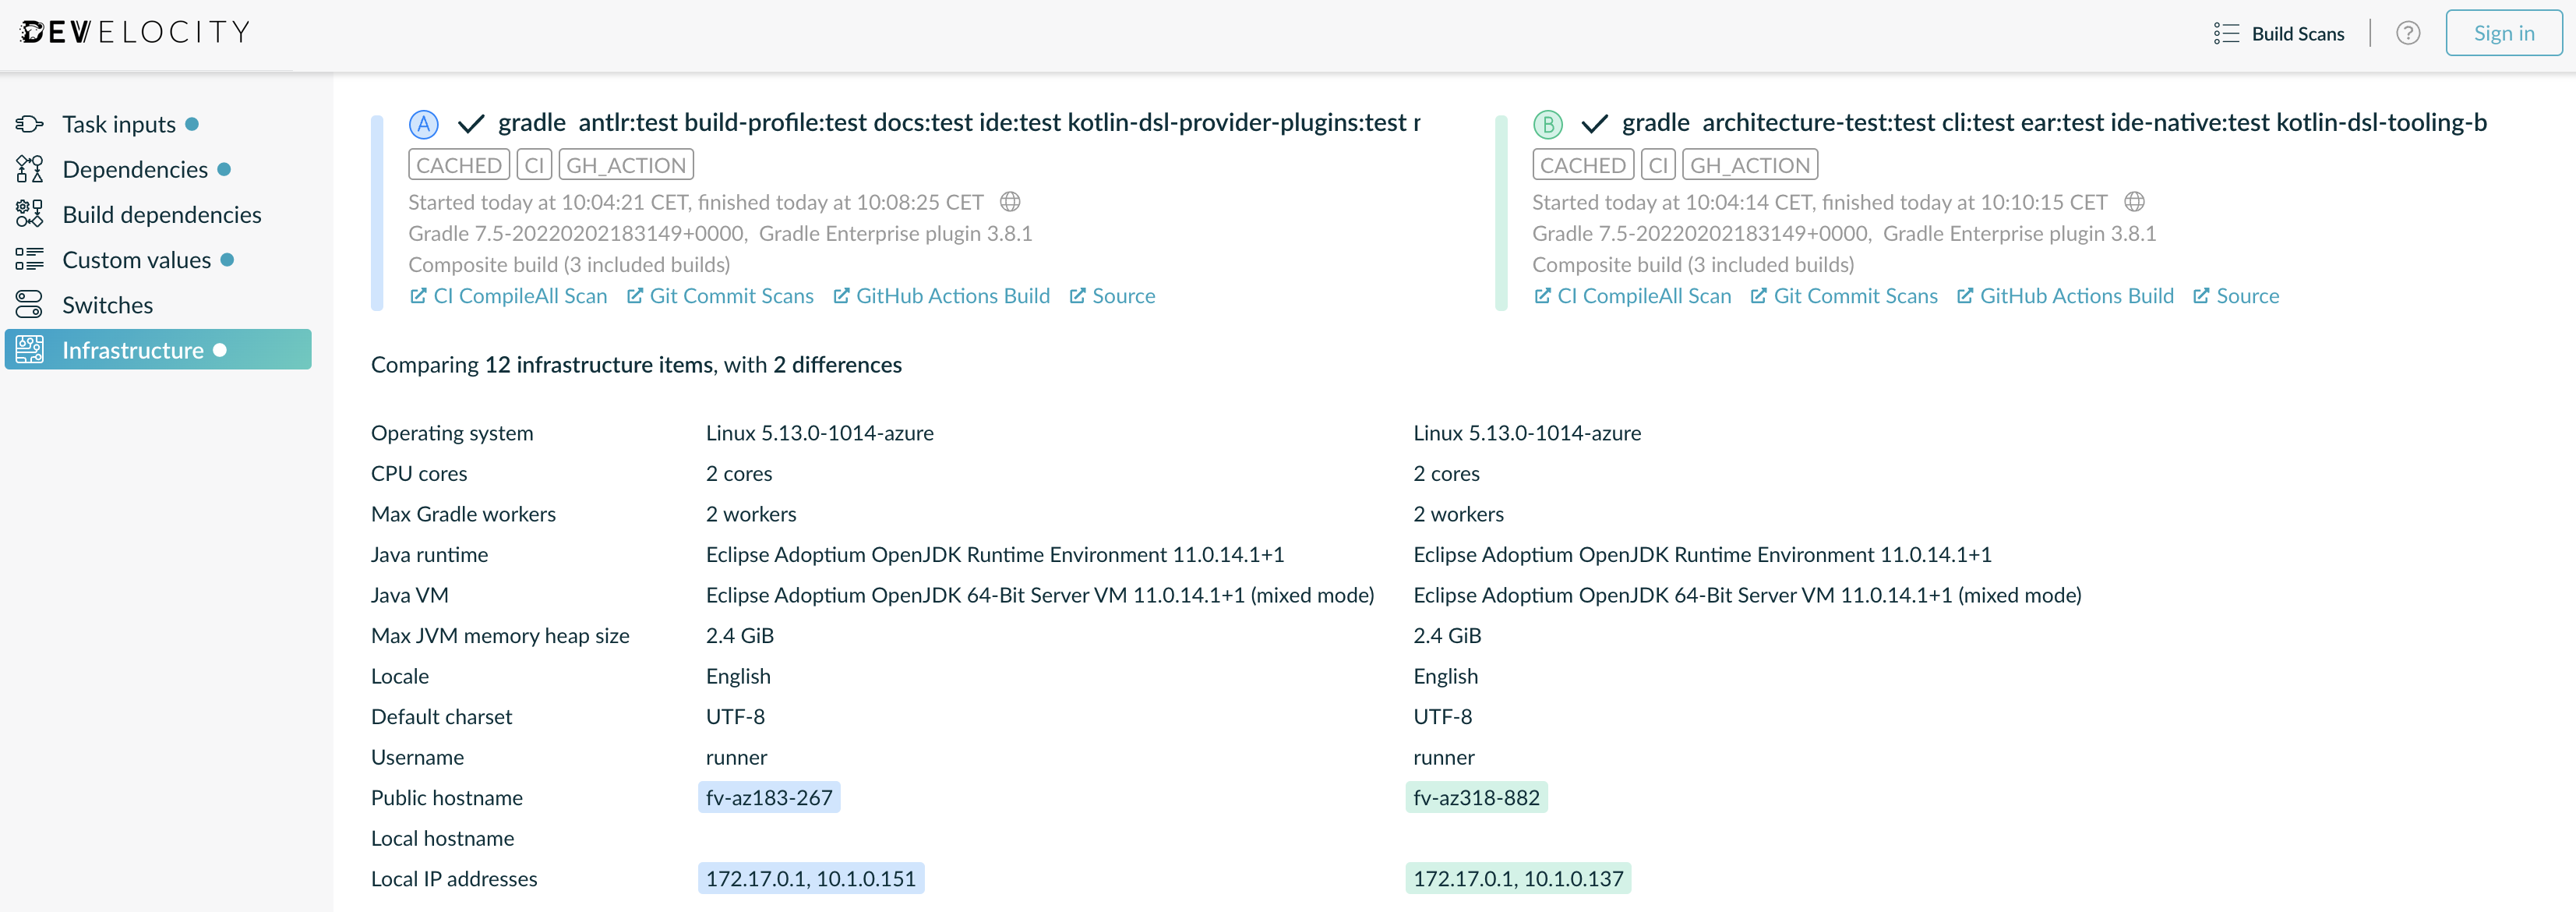
Compare Build Scans to find differences
Develocity provides the ability to compare aspects of two Build Scans, including the inputs into the executed tasks, the resolved dependencies, what switches the builds were invoked with and aspects of the build infrastructure such as the environment where the builds were run.
To compare two scans, use the scan list to find the scans to compare, selecting them by clicking the respective ![]() or
or ![]() icon. Or, from a scan that you wish to compare with another, click the
icon. Or, from a scan that you wish to compare with another, click the ![]() Compare Build Scan
Compare Build Scan
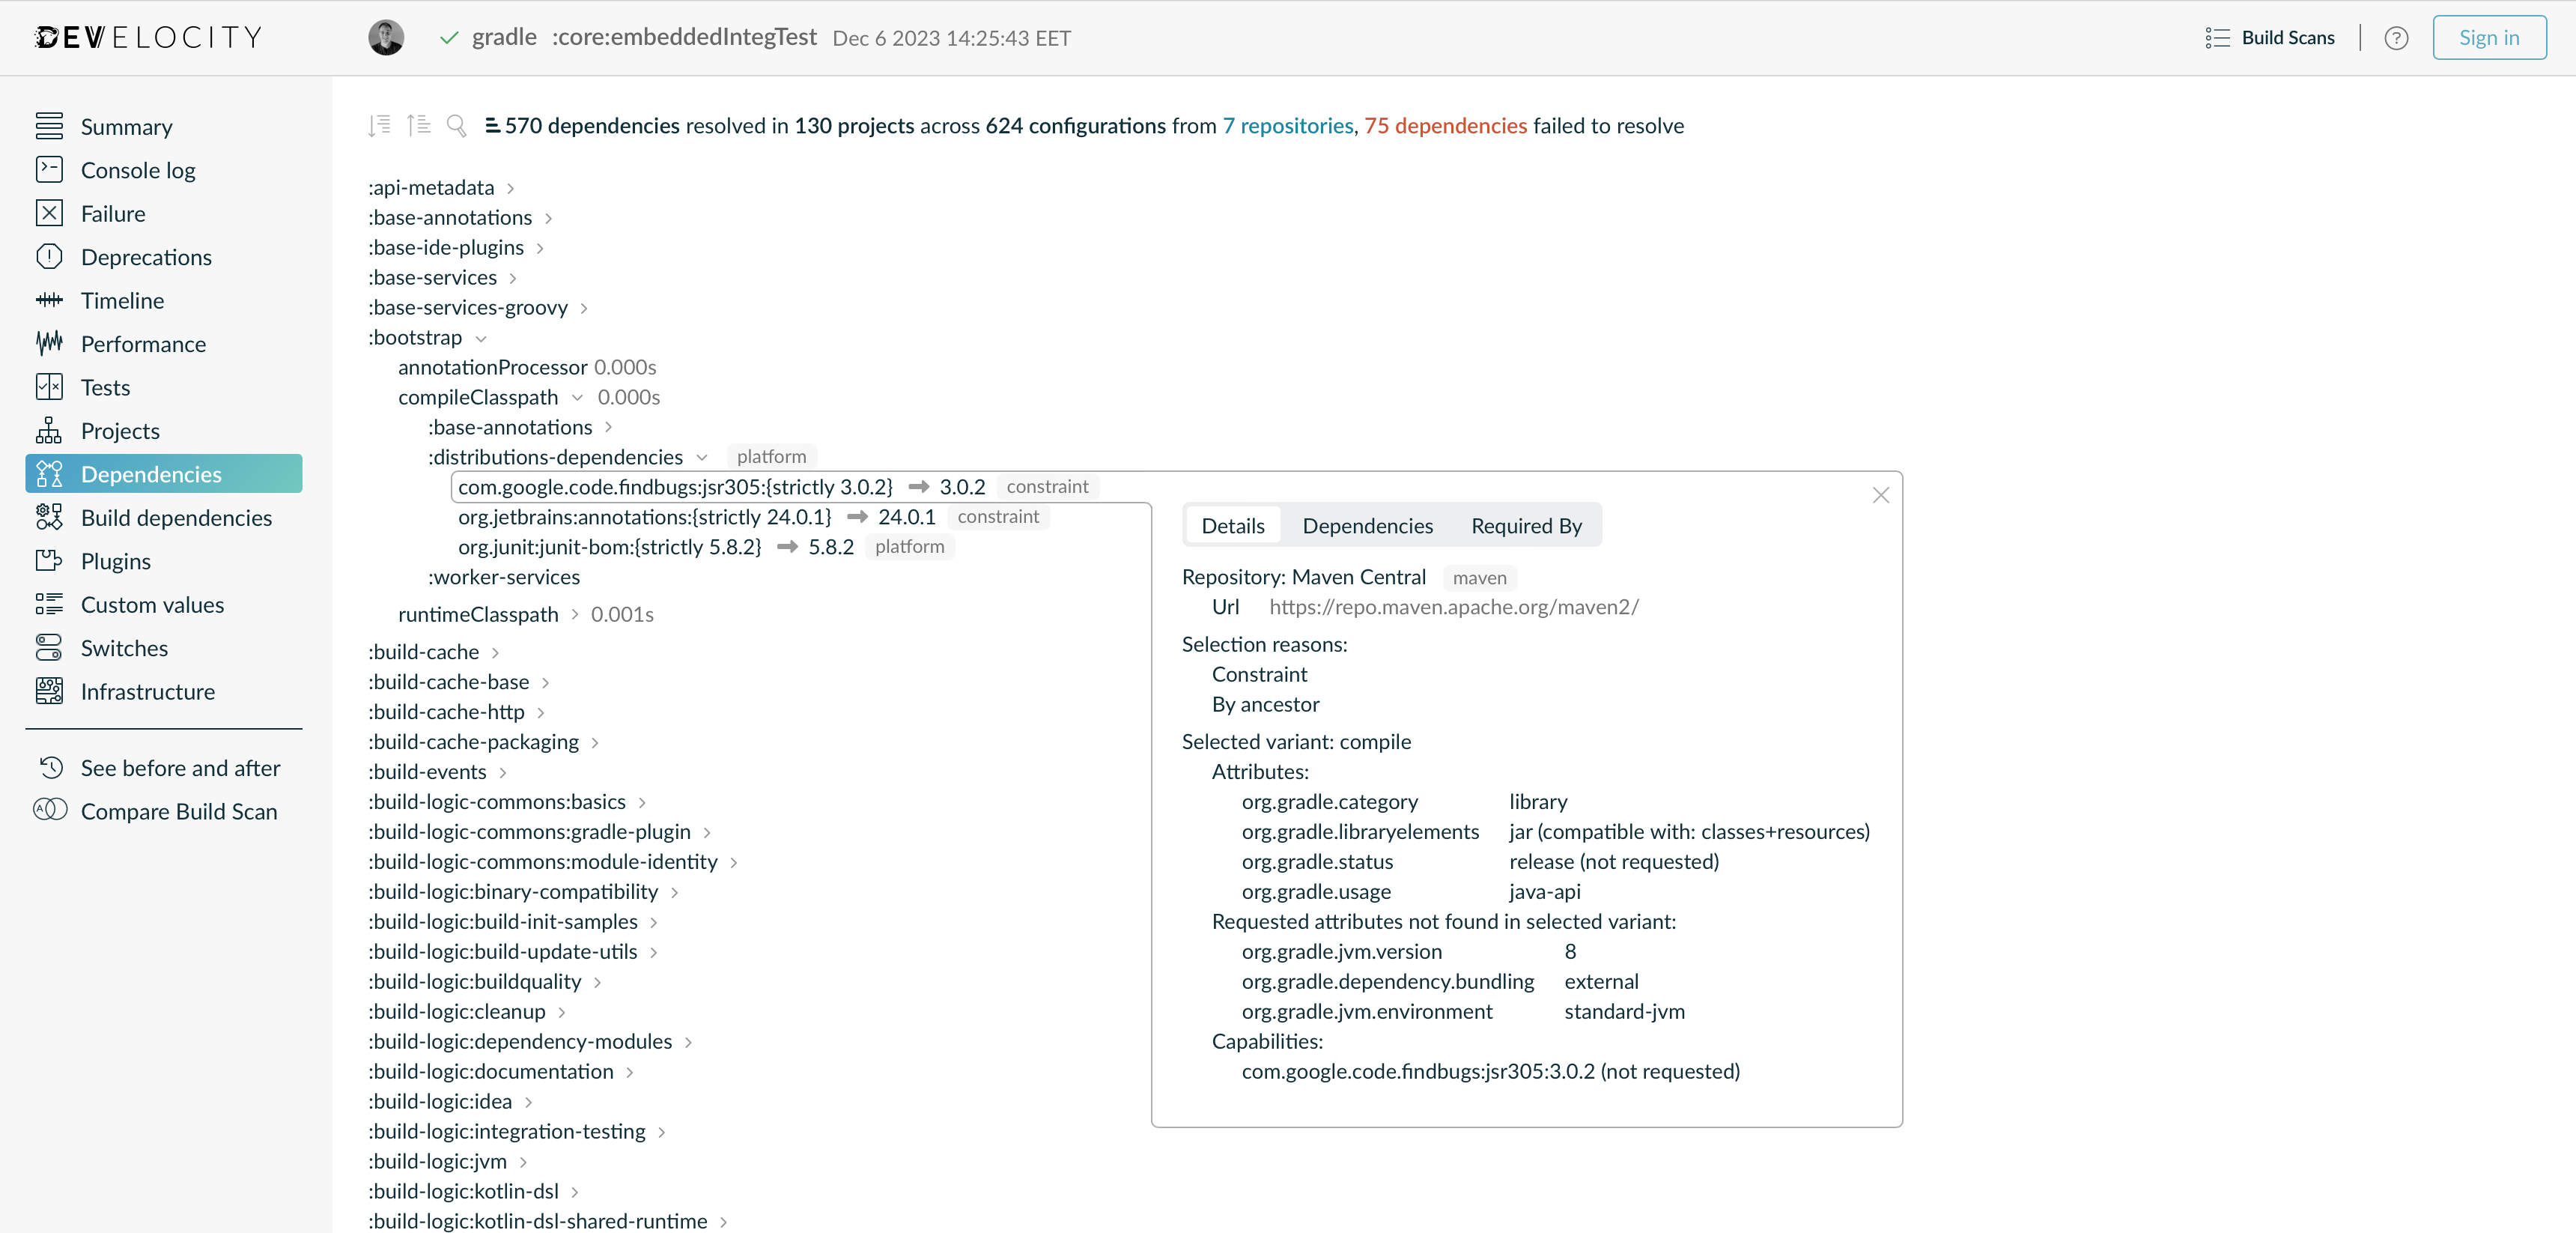
Understand your dependencies
Each Build Scan provides an interactive visualization of every dependency configuration resolved during that build. You can search for dependencies across all projects within the build by name, and also by types of resolution such as dynamic version resolutions.
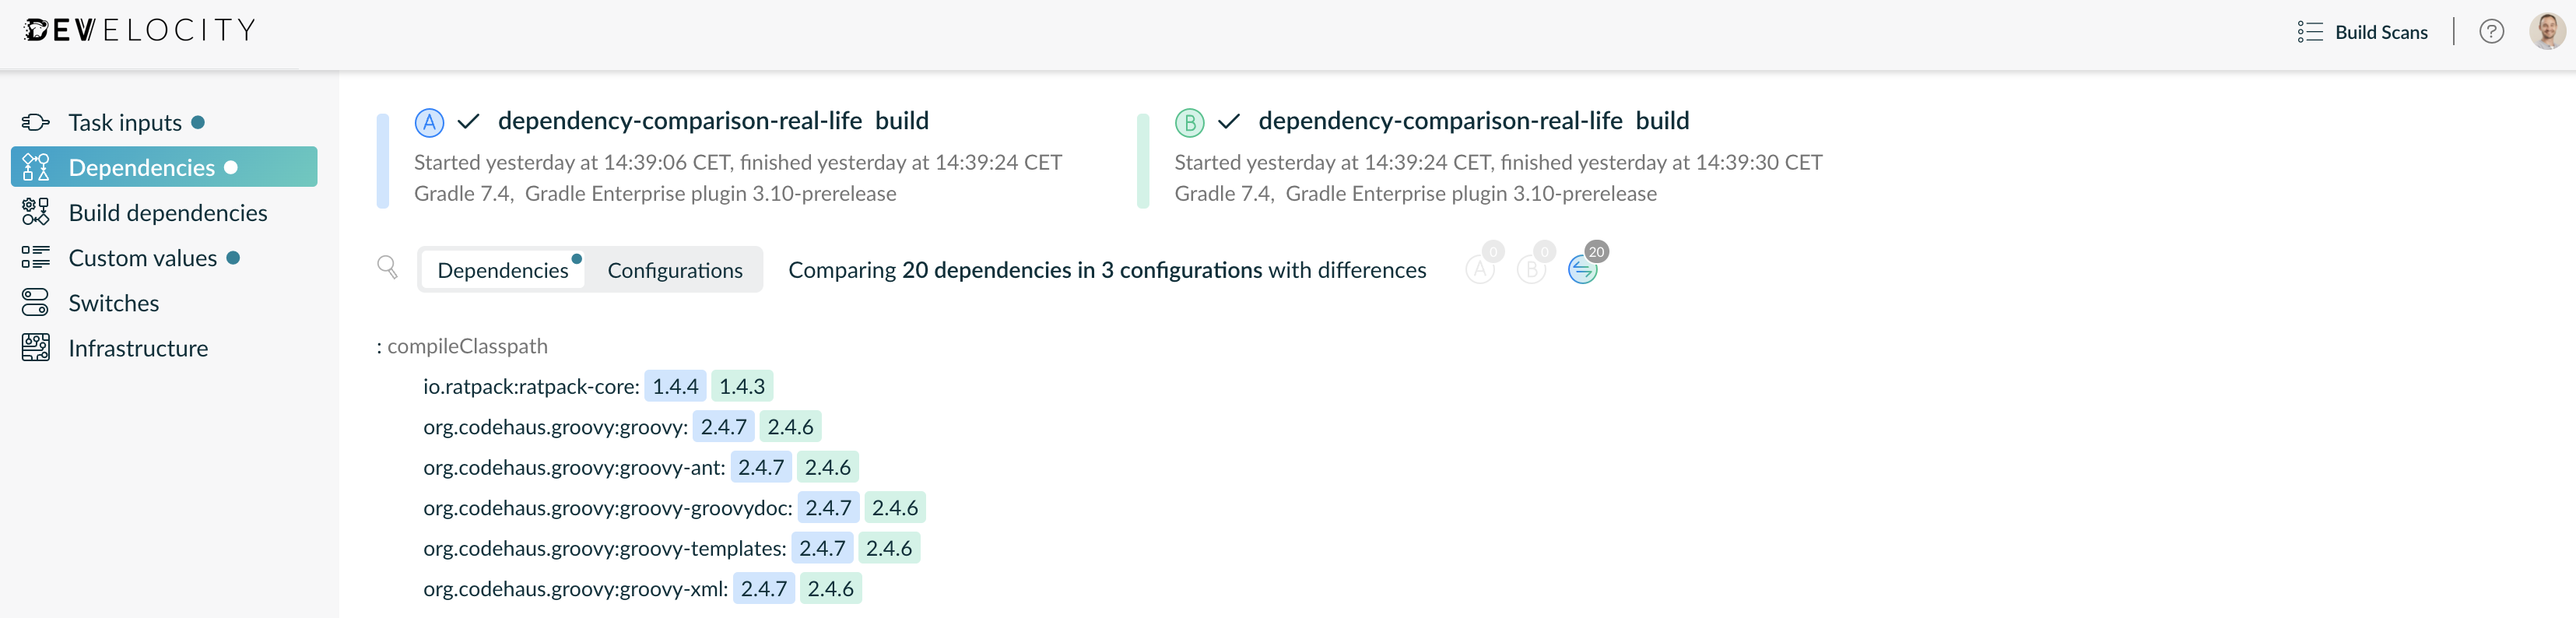
Dependency comparison shows the differences in the resolved dependency configurations between two builds. This is useful for highlighting unanticipated changes, and as the entire graph is compared including transitive dependencies, visualizing the full impact of a change.
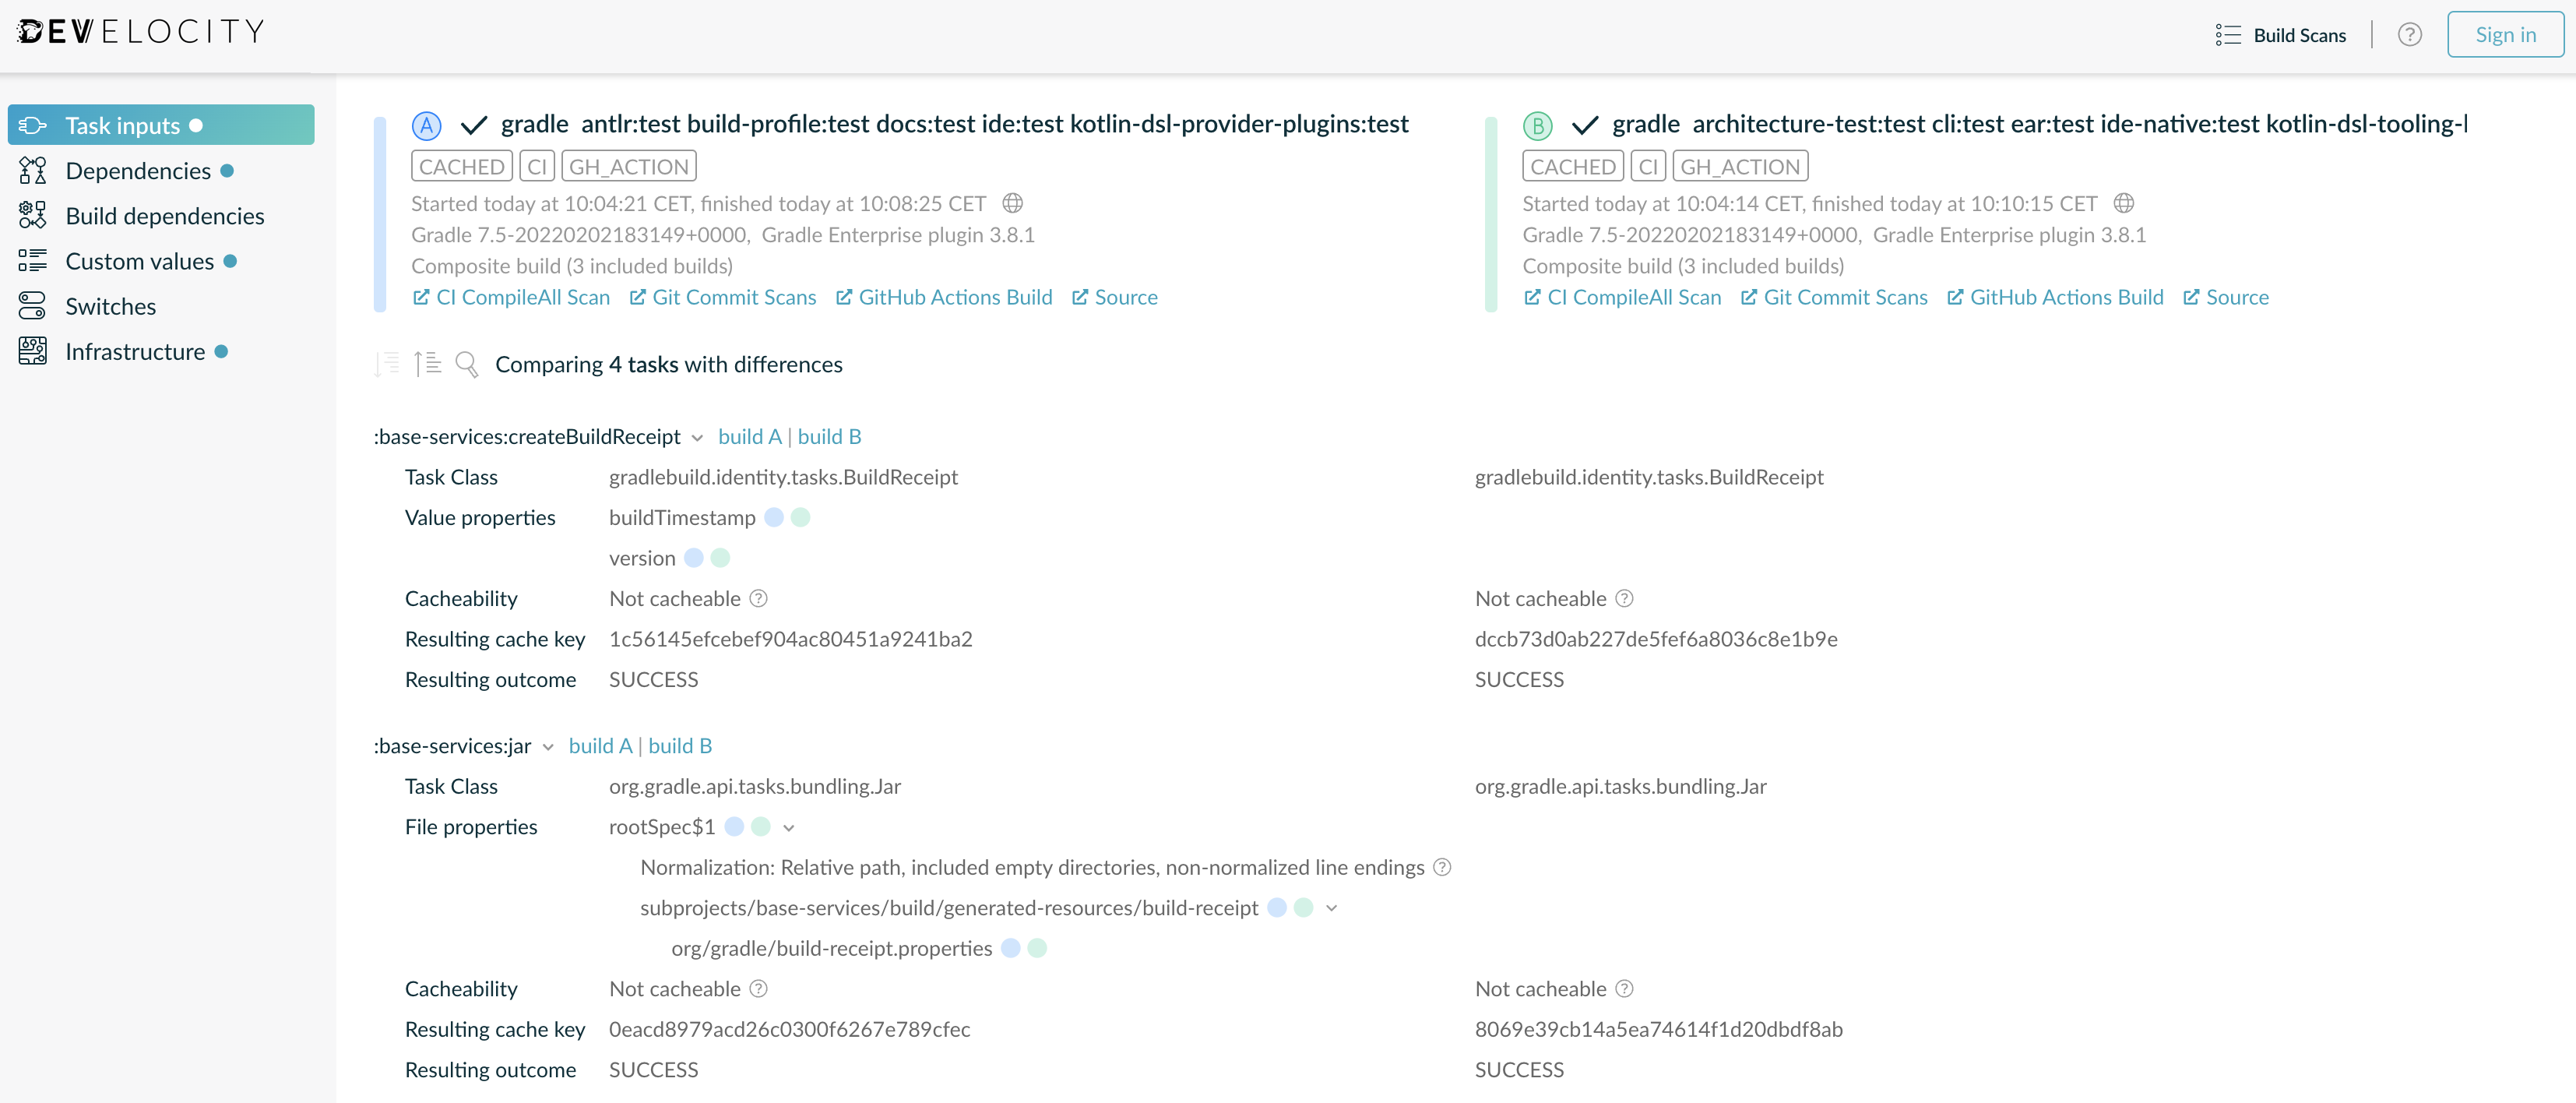
Diagnose incremental build and build caching issues
The task inputs comparison is particularly effective in helping diagnose issues with incremental build and build caching, particularly cases where reuse was expected but didn’t occur. In such cases, it is common that a non-obvious input has actually changed which is preventing reuse. By comparing the inputs of the task from the builds where reuse was expected, the exact input property with a different value between the builds is immediately apparent.
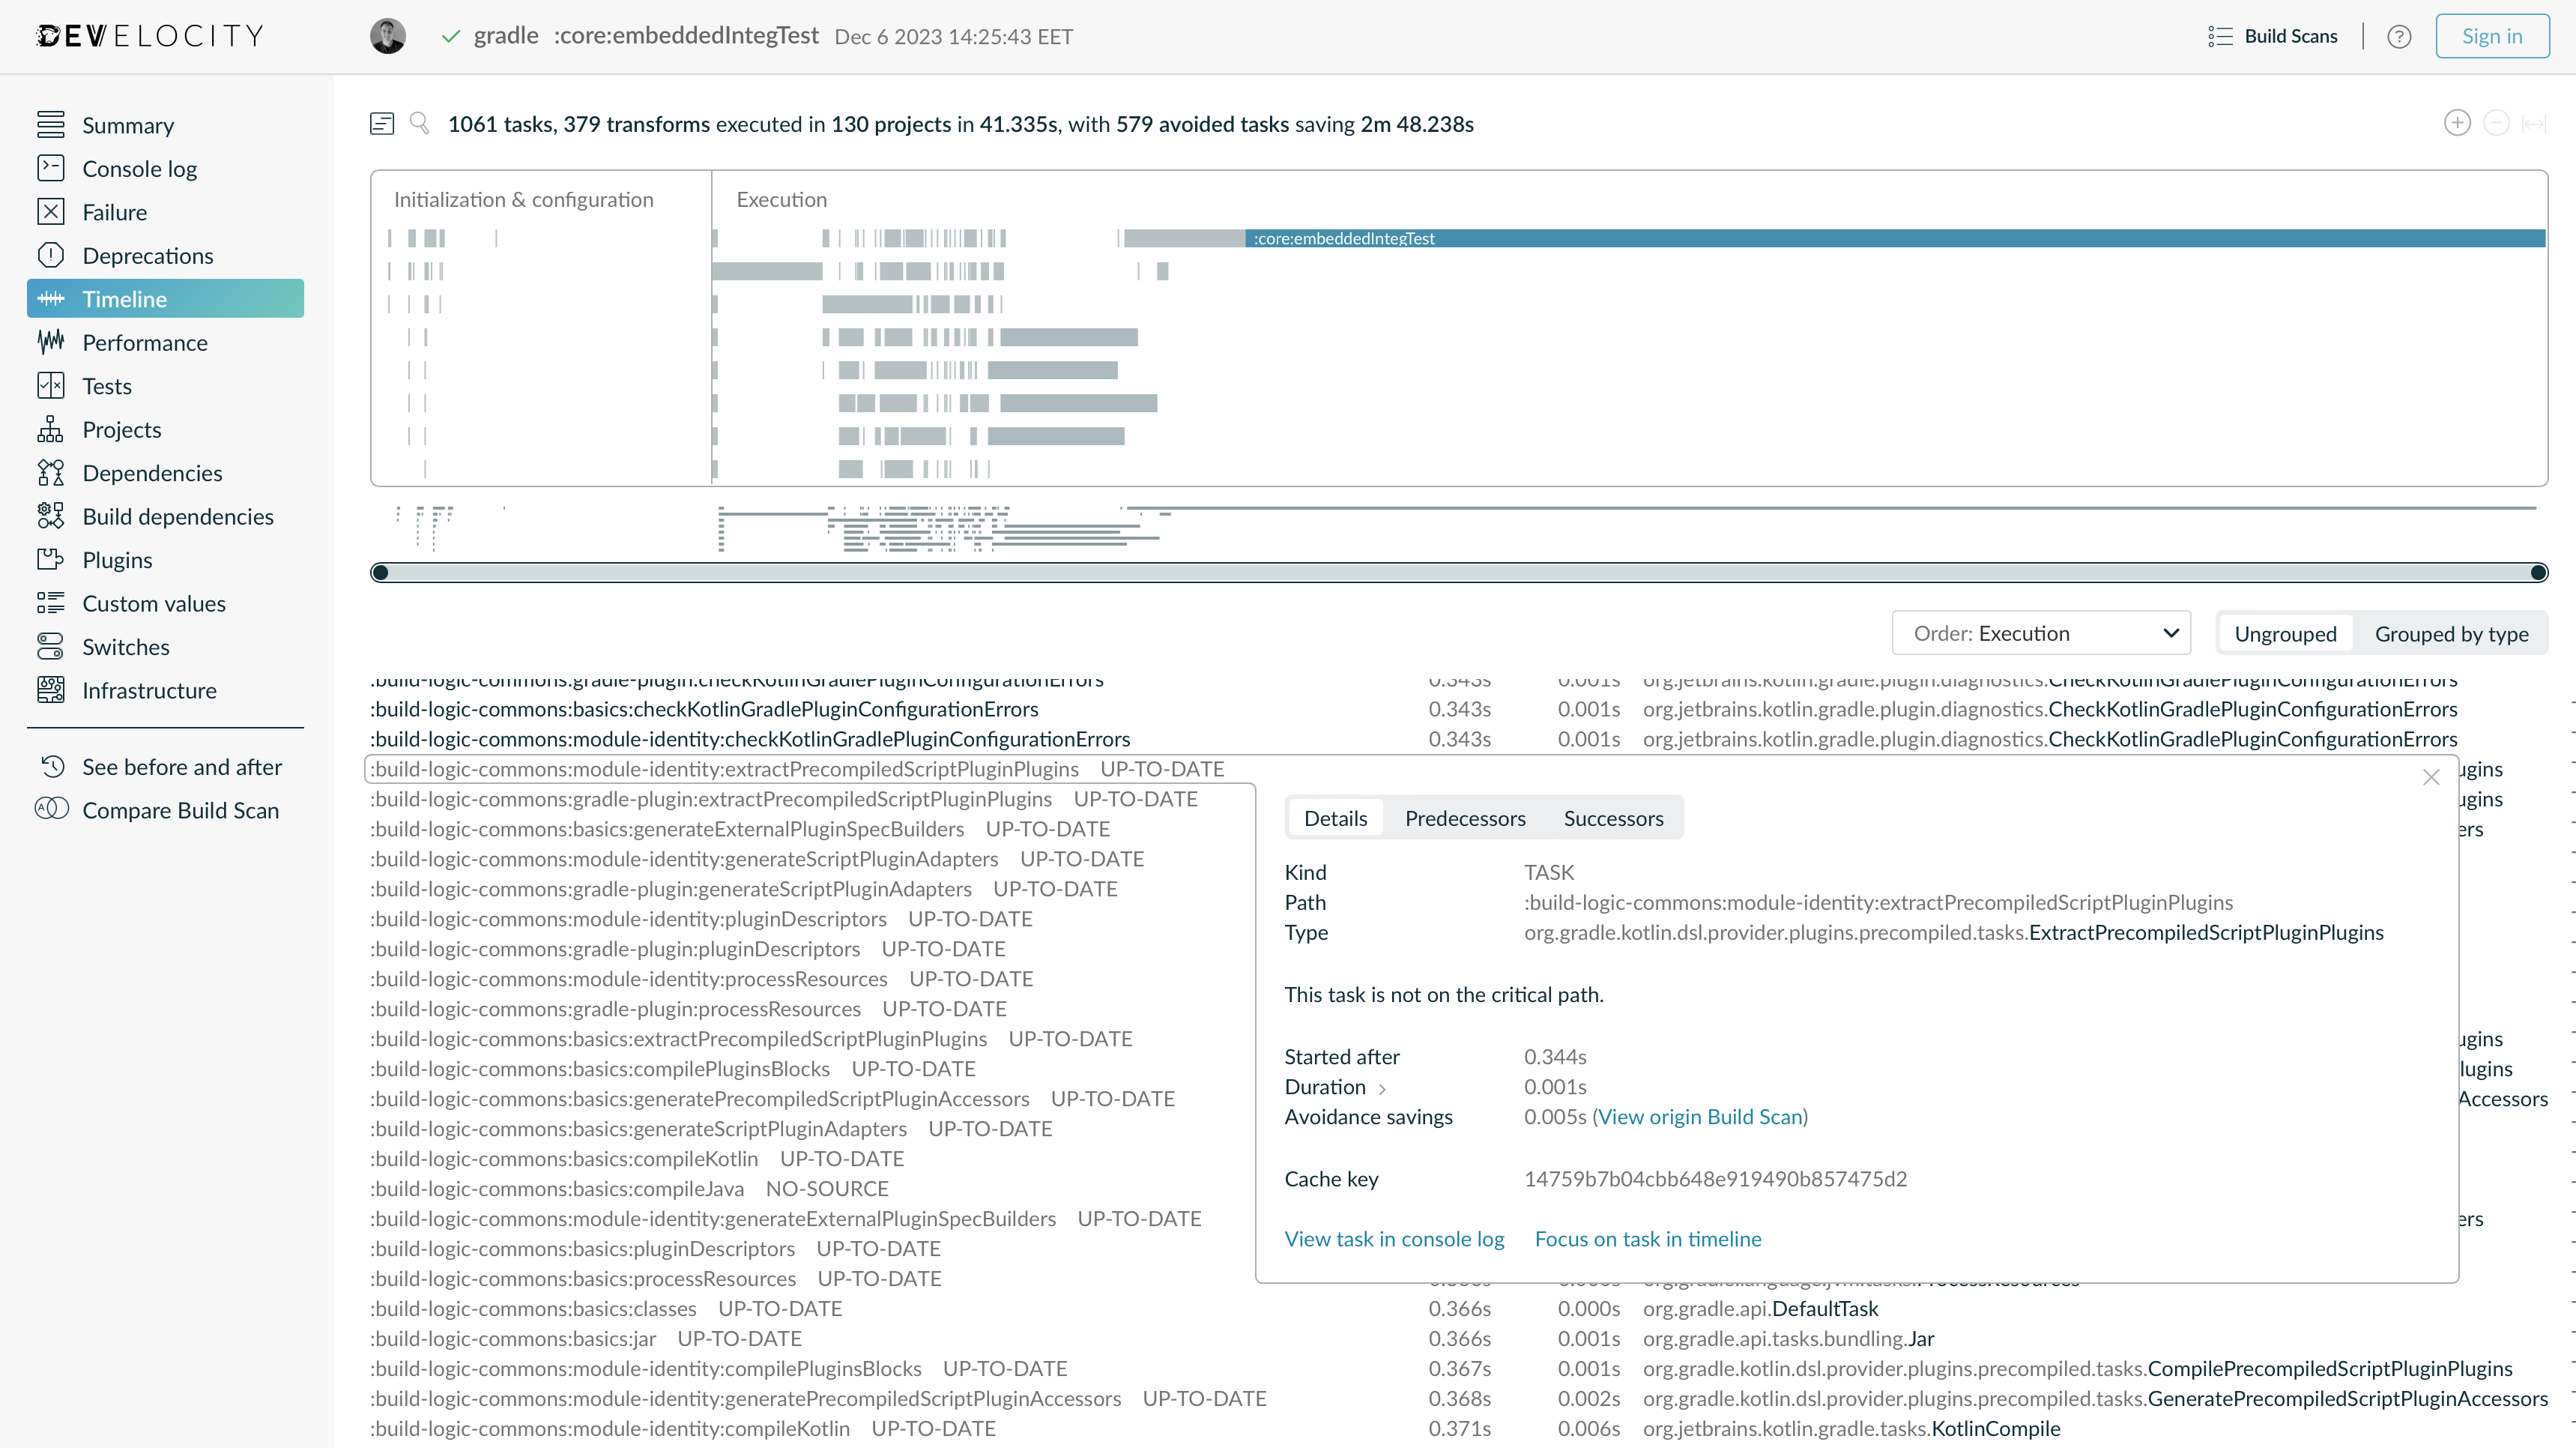
Trace reused task outputs to their origin
When task outputs are reused in a build, due to incremental build or build caching, the Build Scan for that build provides links to the Build Scan of the origin build.
This feature can be used to provide an audit trail of build outputs, and for validating reuse. It is particularly useful for identifying and diagnosing incorrect reuse, which is typically caused by under declaration of task inputs. In such cases, the Build Scan for the origin build can be used to determine the actual input state for cross referencing with the Build Scan that incorrectly reused the outputs.
To see this feature in action, create two Build Scans where one reuses output from another. The simplest way to do this is by running exactly the same build twice. View the Build Scan for the subsequent build and open the timeline visualization. Click on the name of any task that was UP-TO-DATE, and click the View origin Build Scan link to view the Build Scan for the build that produced the reused outputs.
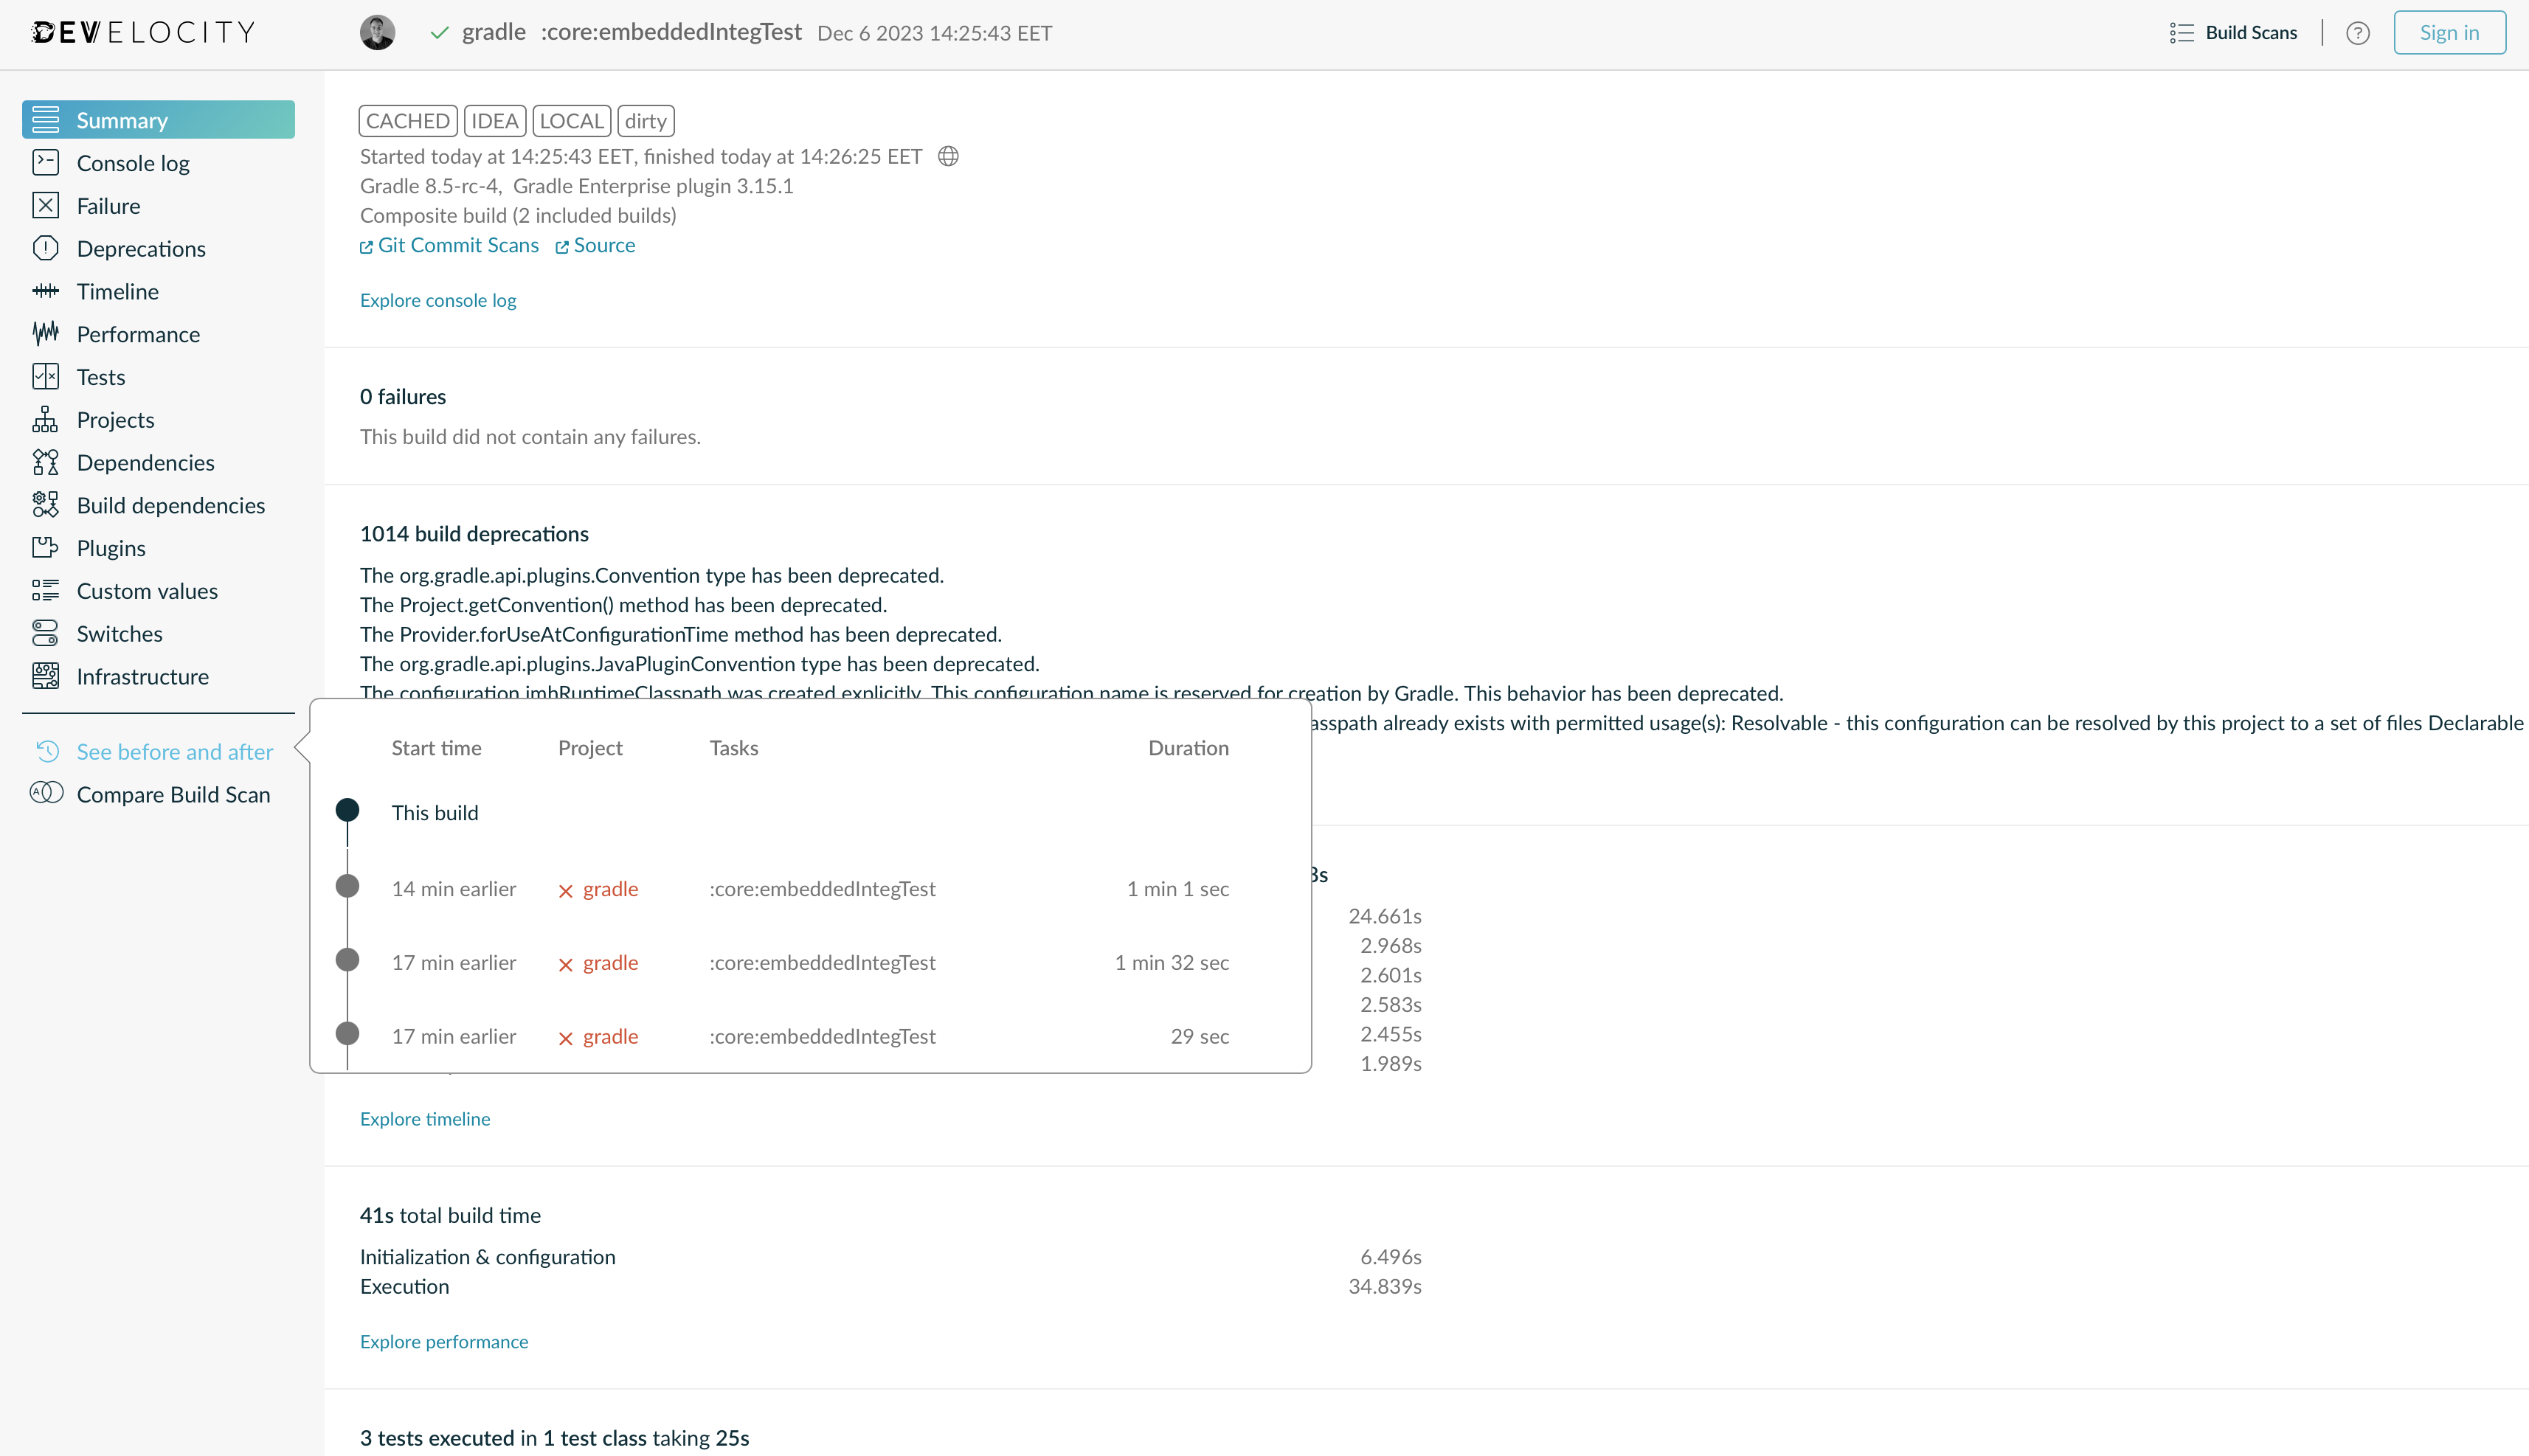
View prior and subsequent builds
From a Build Scan, you can easily navigate to prior or subsequent builds from the same root project directory. This equates to builds of the same project for a particular user on a particular machine. For example, when running two builds consecutively for the same project, from either Build Scan you can easily navigate to the other.
To see this feature in action, create two Build Scans from the same project. From either Build Scan, click the ![]() See before and after
See before and after
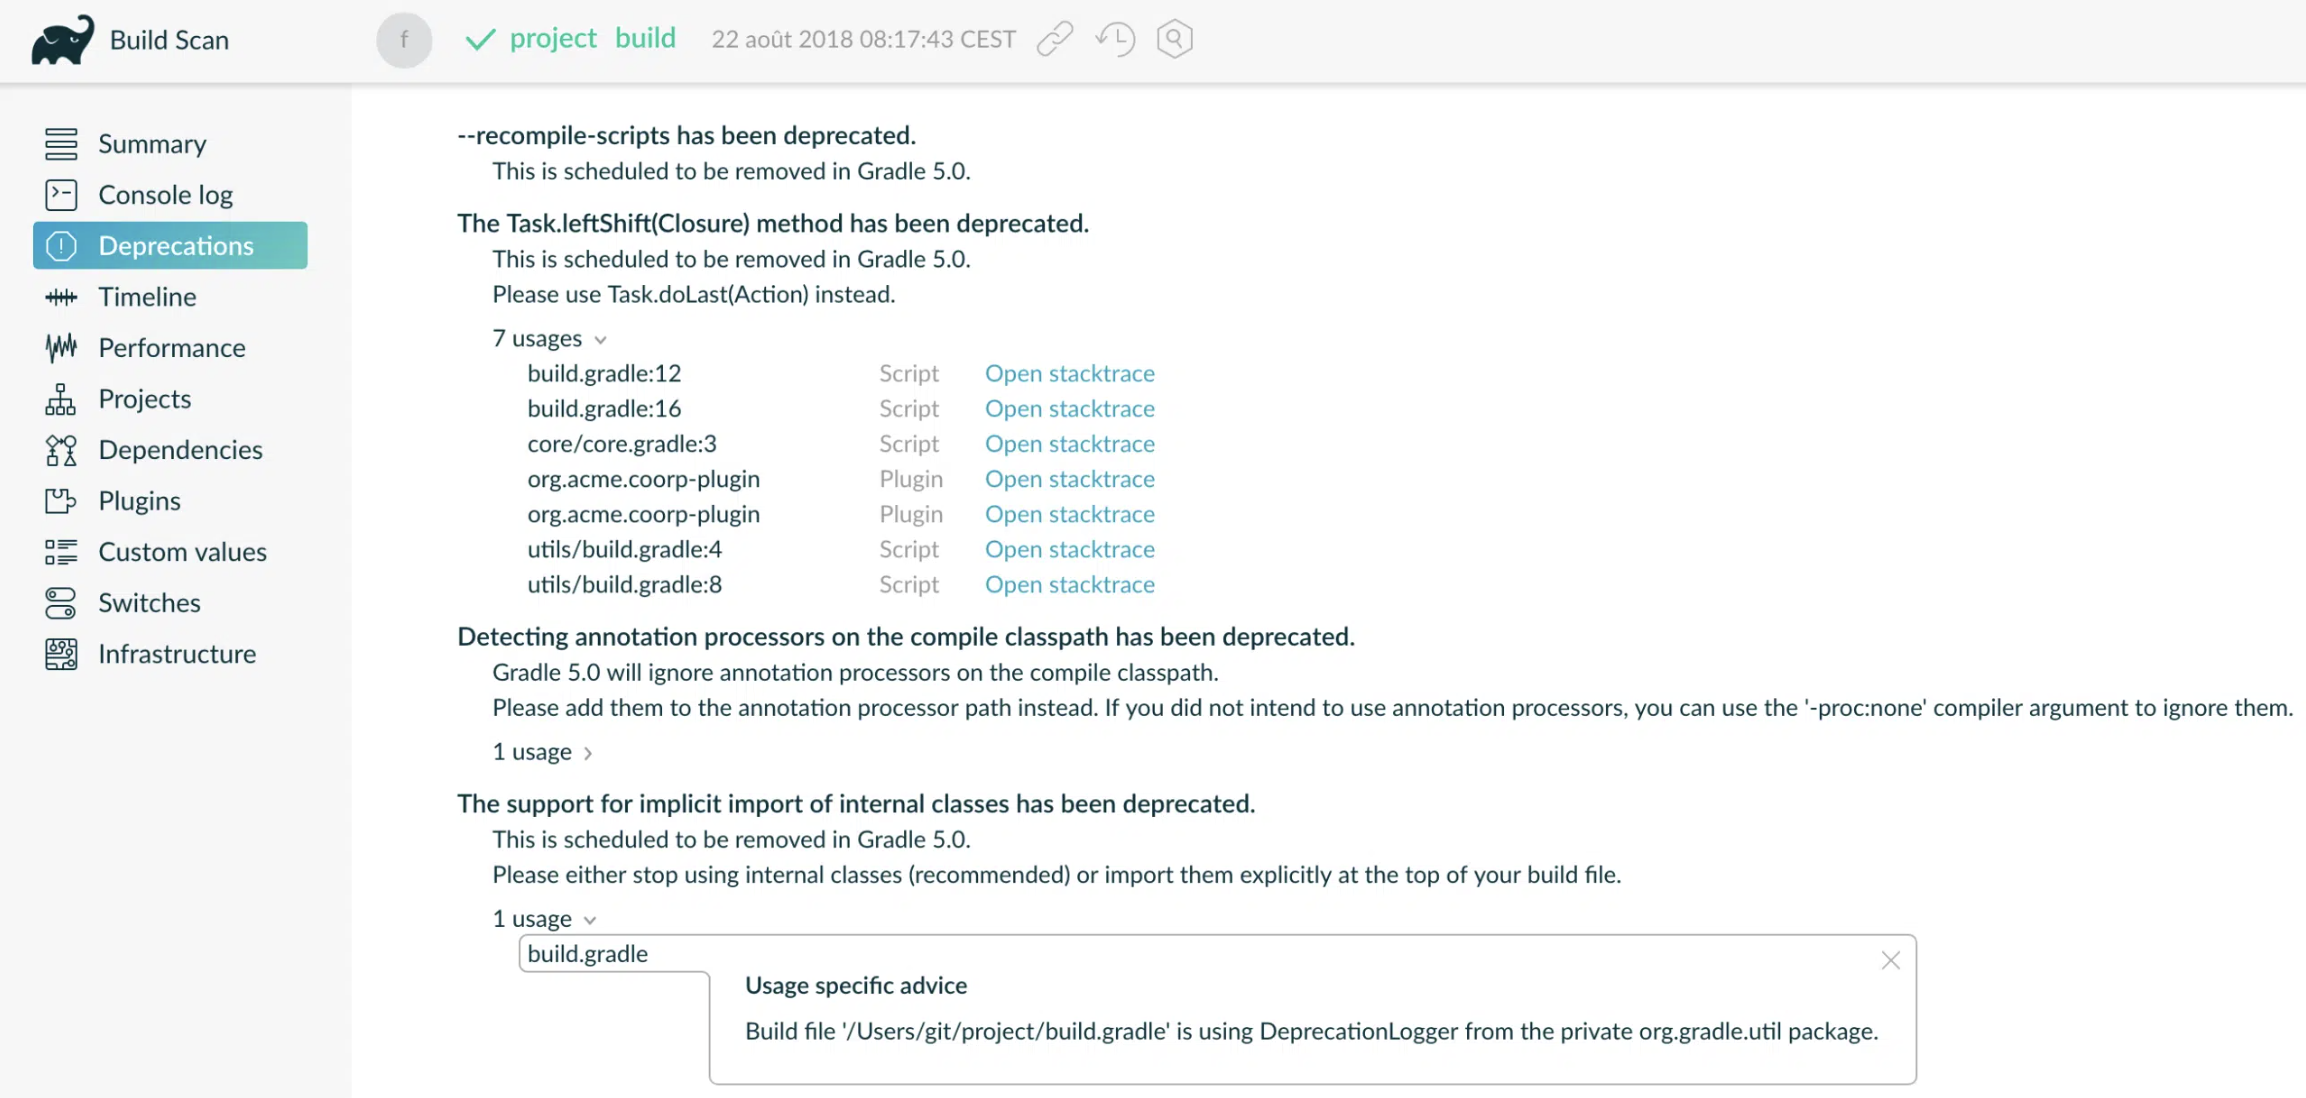
Identifying deprecated Gradle functionality
Develocity provides comprehensive observability into any deprecated Gradle functionality utilized within your builds:
-
Assess the extent of deprecation usage across your projects
-
Prioritize remediation efforts based on impact and frequency
-
Efficiently fix these issues to prevent build failures in upcoming Gradle releases
By identifying and resolving deprecations with Build Scan, you ensure your build logic remains robust and future-proof.
Next steps
Always publishing a Build Scan
The Build Scan plugin can be configured to publish a Build Scan for every build invocation, or, always publishing if certain programmatically defined criteria are met, or, always publishing if the build fails. The dedicated Develocity Gradle Plugin User Manual provides a section outlining how to do this.
It is strongly recommended to configure your builds to always publish Build Scans, for every build. Collecting Build Scans for every build yields deeper visibility and insights into how your build is performing and is being used, as well as making features such as tracing reused task outputs more effective.
Custom tags, values and links
Build Scans can be enriched with metadata particular to your environment by using an API provided by the Build Scan plugin.
Extending your Build Scans with tags, values and links is strongly recommended. In particular:
-
VCS information such as commit identifiers, branch names, etc.
-
Tags for different types of builds (e.g.
CIvs.local) -
Links to CI system record of build for CI builds
This adds useful context to your Build Scans.
Integrating your CI tool
Build scans are passive with regard to the build process. That is, enabling Build Scans does not affect the outcome or outputs of your build. As such, it is generally safe to simply add the necessary configuration to your projects to enable sending Build Scans to your Develocity installation and check it in to version control, enabling it for all users of the build.
The Build scan plugin will not cause build failures, even when there is no connection available to the Develocity server when trying to publish.
Jenkins
The Gradle Jenkins plugin prominently displays links to the Build Scan for any Gradle or Maven build that produce Build Scans, which makes it convenient to access the Build Scans. See the following screenshot for an example:
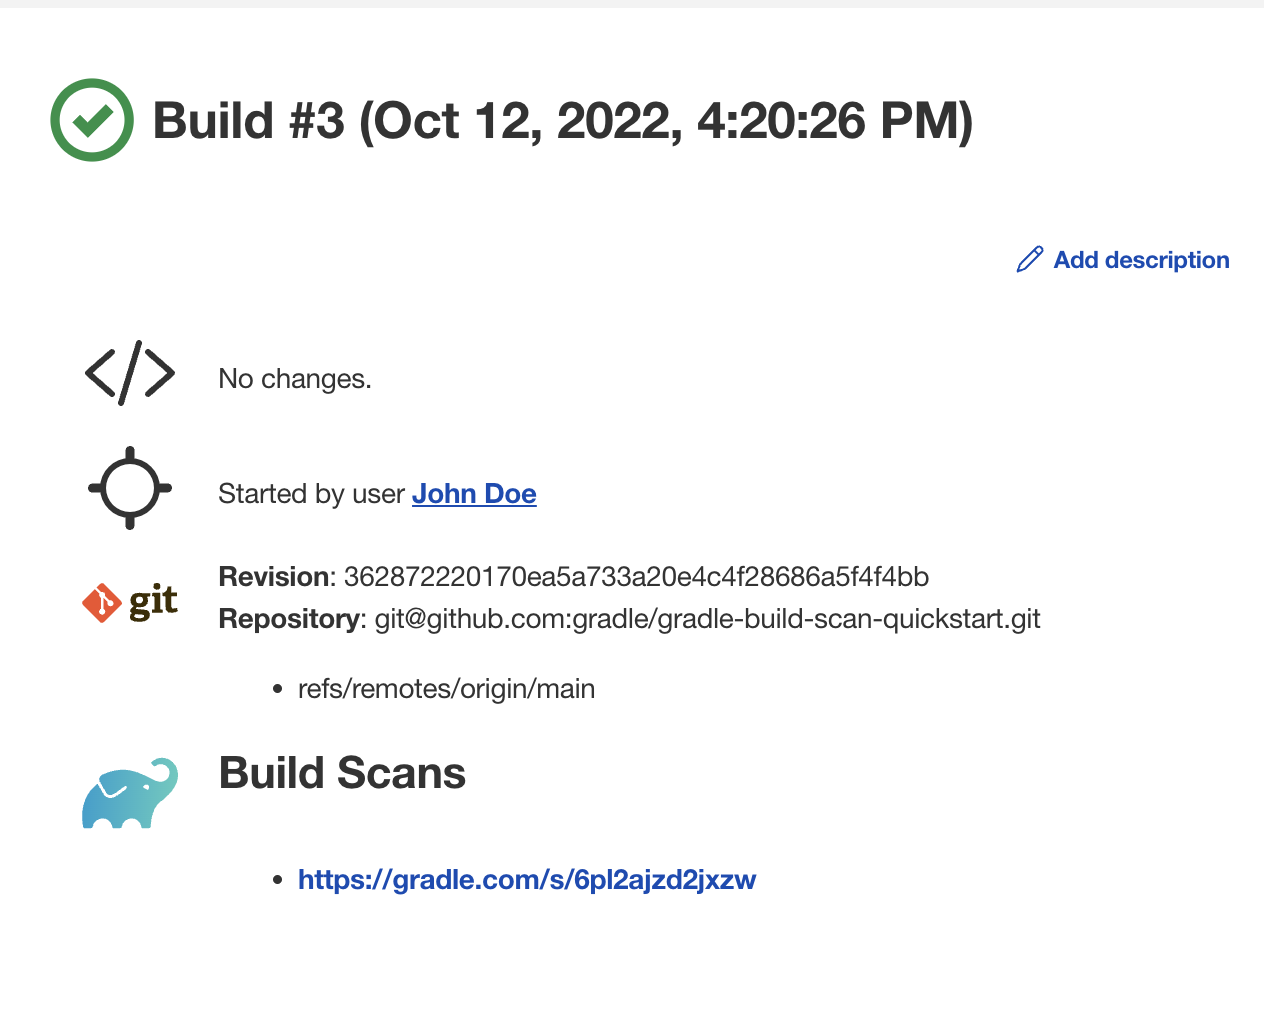
Besides that, the plugin allows you to instrument all CI jobs and to publish a Build Scan without modifying the underlying projects. This eases the adoption of Build Scans within the company and allows configuring the Develocity Gradle plugin or Develocity Maven extension in a central place. For more information please read the documentation here.
TeamCity
The Develocity integration plugin prominently displays links to the Build Scan for any Gradle or Maven build that produce Build Scans, which makes it convenient to access the Build Scans. See the following screenshot for an example:
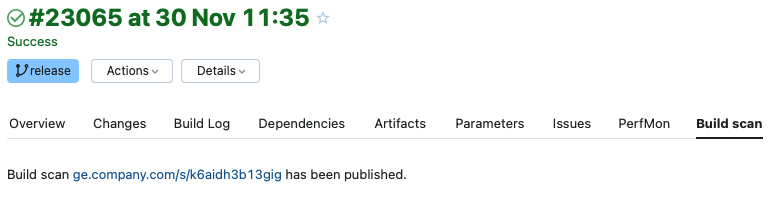
Besides that, the plugin allows you to instrument all CI jobs and to publish a Build Scan without modifying the underlying projects. This eases the adoption of Build Scans within the company and allows configuring the Develocity Gradle plugin or Develocity Maven extension in a central place.
Bamboo
The Develocity Bamboo plugin prominently displays links to the Build Scan for any Gradle or Maven build that produce Build Scans, which makes it convenient to access the Build Scans. See the following screenshot for an example:
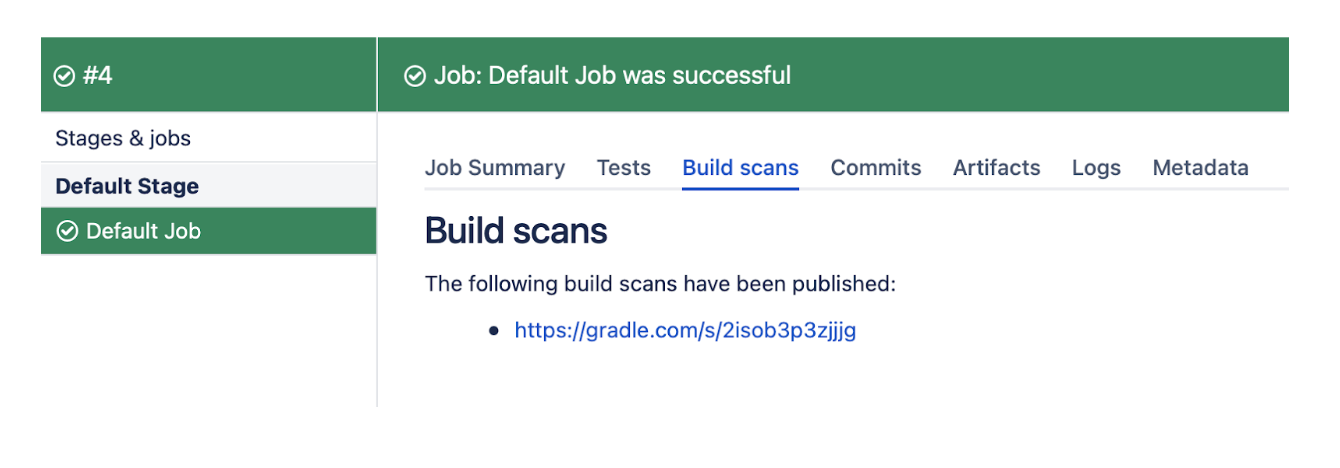
Besides that, the plugin allows you to instrument all CI jobs and to publish a Build Scan without modifying the underlying projects. This eases the adoption of Build Scans within the company and allows configuring the Develocity Gradle plugin or Develocity Maven extension in a central place. For more information please read the documentation here.
GitLab templates
The Develocity GitLab templates allow you to instrument CI jobs and to publish a Build Scan without modifying the project’s build scripts. This eases the adoption of Build Scans within the company and allows configuring the Develocity Gradle plugin or Develocity Maven extension at the CI level. For more information please read the documentation here.
GitHub Actions
The Gradle GitHub Action prominently displays links to Build Scan data for any Gradle build that produces it, making the data easily accessible.
The action allows you to instrument all CI jobs and publish a Build Scan without modifying the underlying Gradle build, using environment variables defined in your GitHub Actions workflow. You can configure the Develocity Gradle plugin at the CI level using environment variables in your GitHub Actions workflow.
See the following screenshot for an example:
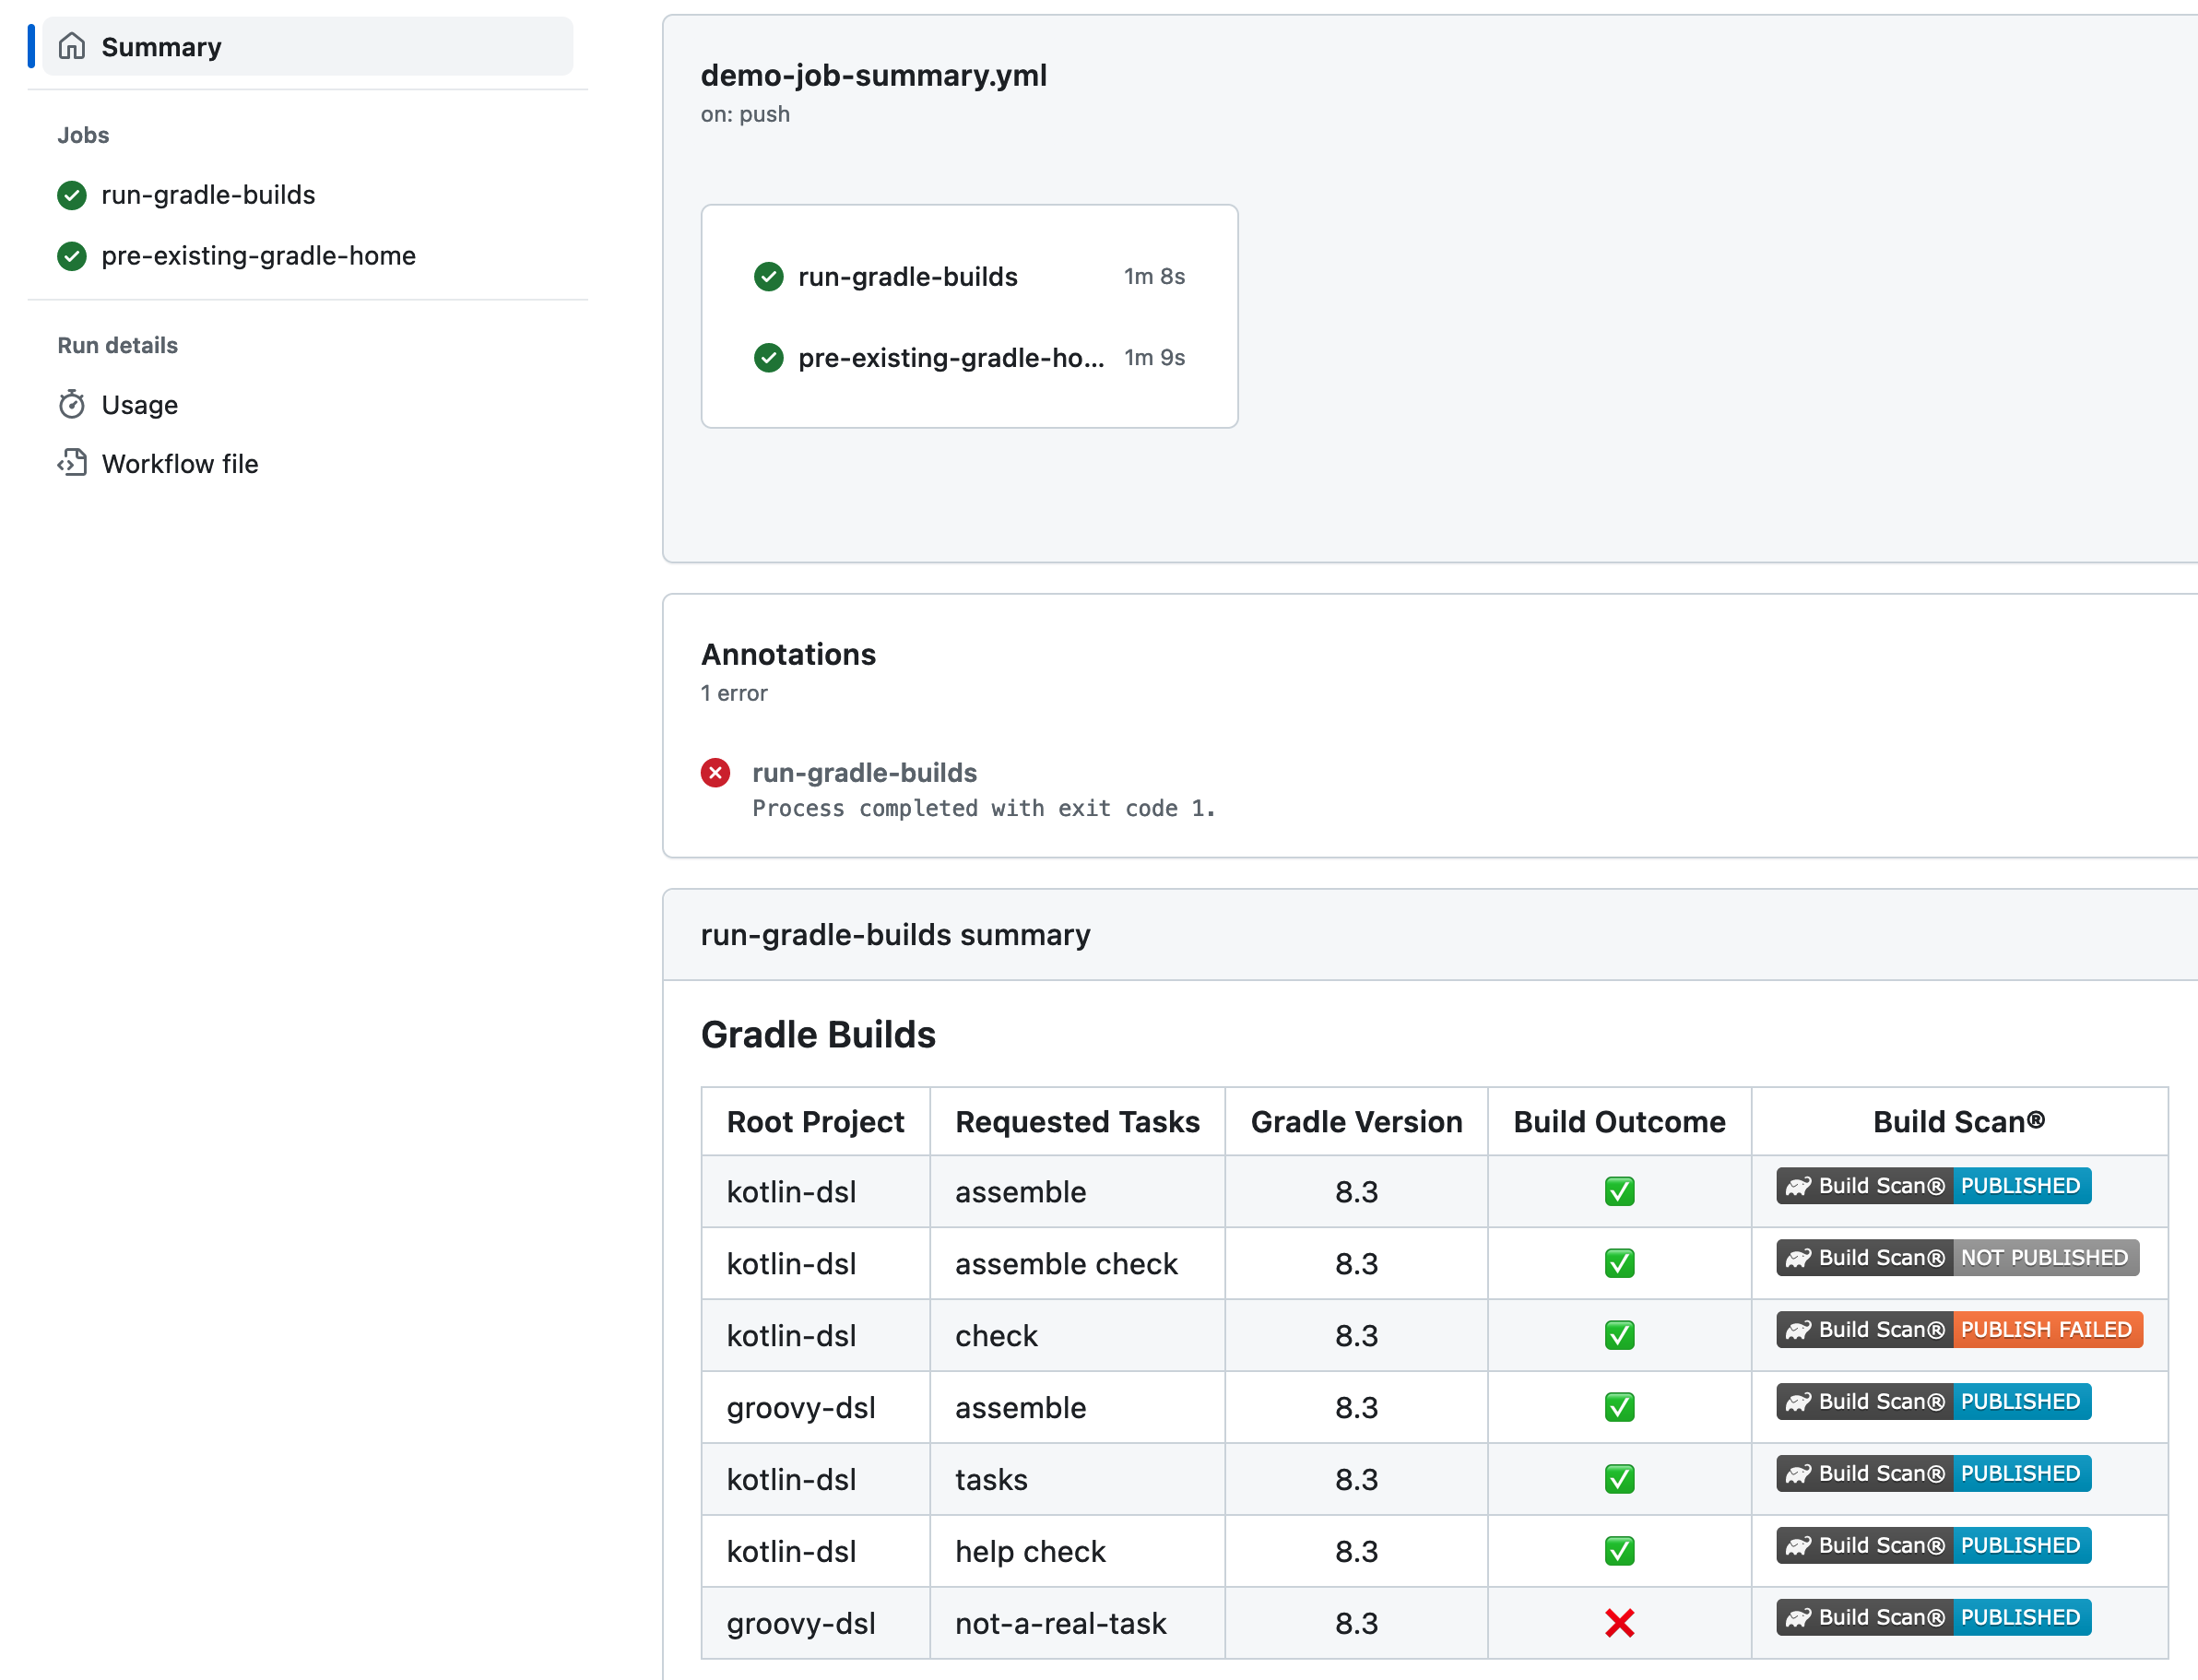
For more information, see the Gradle GitHub Action documentation.
Integration with IntelliJ IDEs
The Develocity IntelliJ plugin seamlessly integrates Develocity and Build Scan capabilities directly into your IDE. It displays a live timeline of task execution and resource usage within your IntelliJ IDE.
Moreover, it provides a streamlined Develocity configuration for local builds by allowing you to apply and configure the Develocity Gradle plugin to your projects, simplifying the adoption of build performance optimization and troubleshooting.
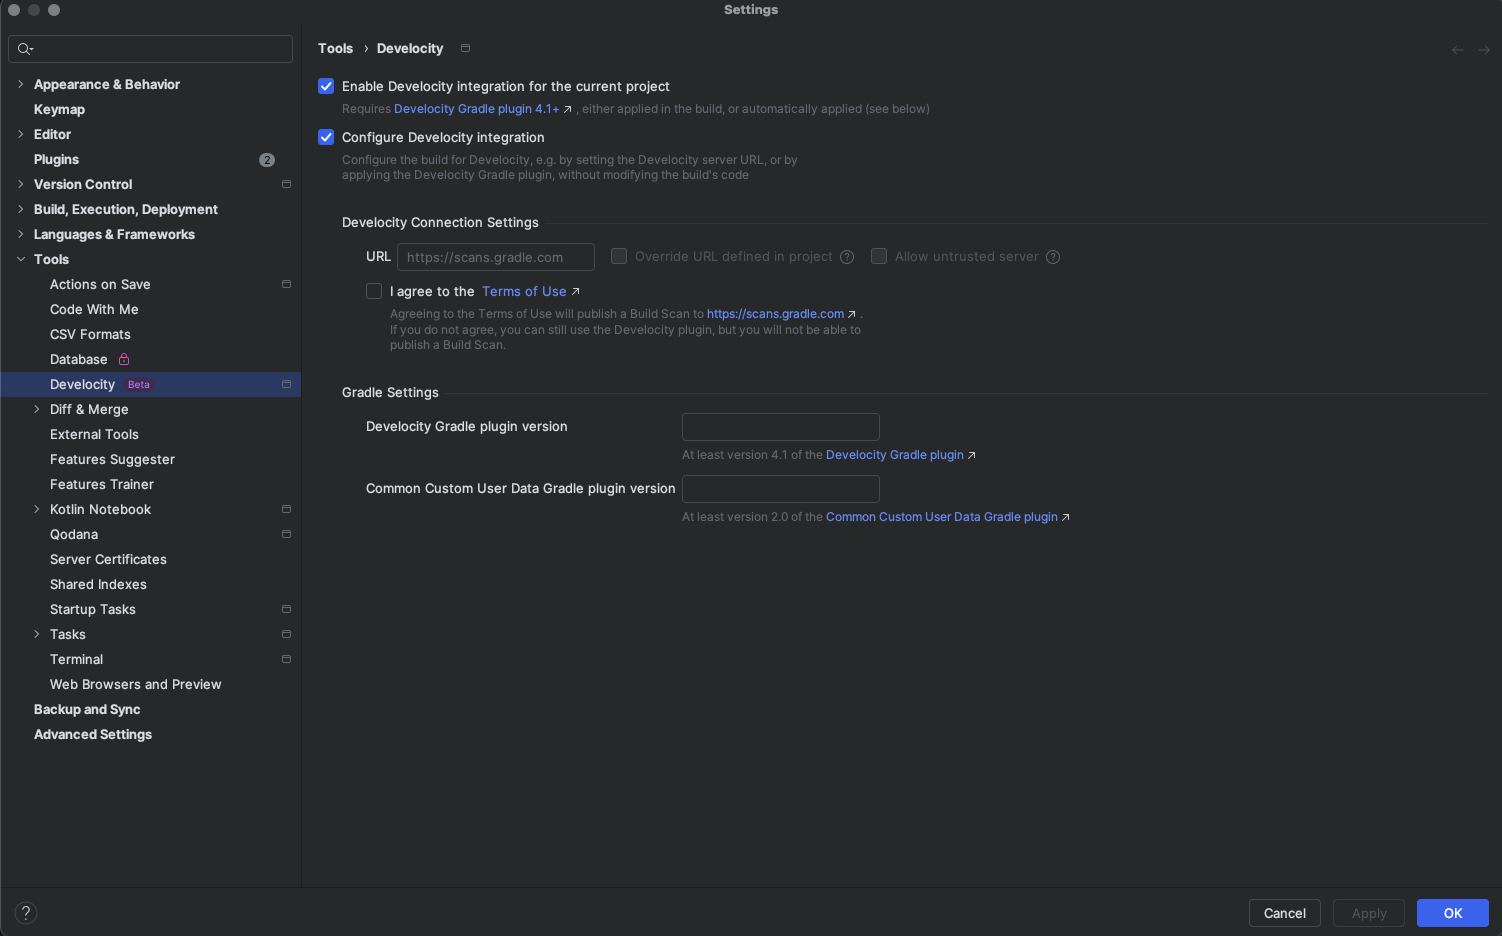
For more information, please read the Develocity IntelliJ Plugin User Manual.
Build Cache
The best way to improve the execution time of yours builds is by not executing something that was already executed, and just reuse the product of this initial execution. Build caching allows to potentially save a tremendous amount of build time by fetching the outputs of certain task executions, from a previous identical execution. Under the hood, a task is a function that takes some inputs and produces some outputs in a deterministic way. By analyzing the task mechanics and its inputs, Gradle can detect whether a given build tries to execute a given task with the same inputs as a previous execution, and decide to reuse the already produced outputs instead of recomputing them.
Develocity provides a centralized Build Cache that can be used to share the results amongst different machines and users.
Quick start
Add the following to your project’s settings file:
buildCache {
  local {
    isEnabled = false (1)
  }
  remote(develocity.buildCache) {
    server = "https://develocity.example.com" (2)
    path = "/cache/" (3)
    isPush = true (4)
  }
}buildCache {
local {
enabled = false (1)
}
remote(develocity.buildCache) {
server = "https://develocity.example.com" (2)
path = "/cache/" (3)
push = true (4)
}
}| 1 | Disabling the local Build Cache in order to make the effect of the remote Build Cache more visible |
| 2 | The address of the build cache server to use, if not using the built-in build cache of the server specified with develocity extension |
| 3 | The request path for the build cache server. It is generally not necessary to set this value, as the default value used is suitable for the default configuration of Develocity build cache nodes (including the built-in build cache). |
| 4 | Whether to write to the Build Cache, or just read from it |
| The above configuration disables the local Build Cache for demonstration purposes. Disabling the local Build Cache is generally not recommended and this should be removed for real usage. |
Given the above configuration, you can now run your build with --build-cache.
|
You may encounter problems with an untrusted SSL certificate when you try to use the Develocity Build Cache backend with an HTTPS URL. The ideal solution is for someone to add a valid SSL certificate to the Develocity instance, but we recognize that you may not be able to do that. In that case, set the Disabling SSL certificate checks
Disabling SSL certificate checks
This is a convenient workaround, but you shouldn’t use it as a long-term solution. |
If this is the first time your project is being built while using the remote Build Cache, you will not see any reuse from the Build Cache; only uploads to it. If you run the same build again, you should see output from Gradle indicating that tasks were reused from the Build Cache.
Develocity provides an overview of the Build Cache activity at https://develocity.example.com/cache-admin, which you can use to see the effect of running your build against the Build Cache.
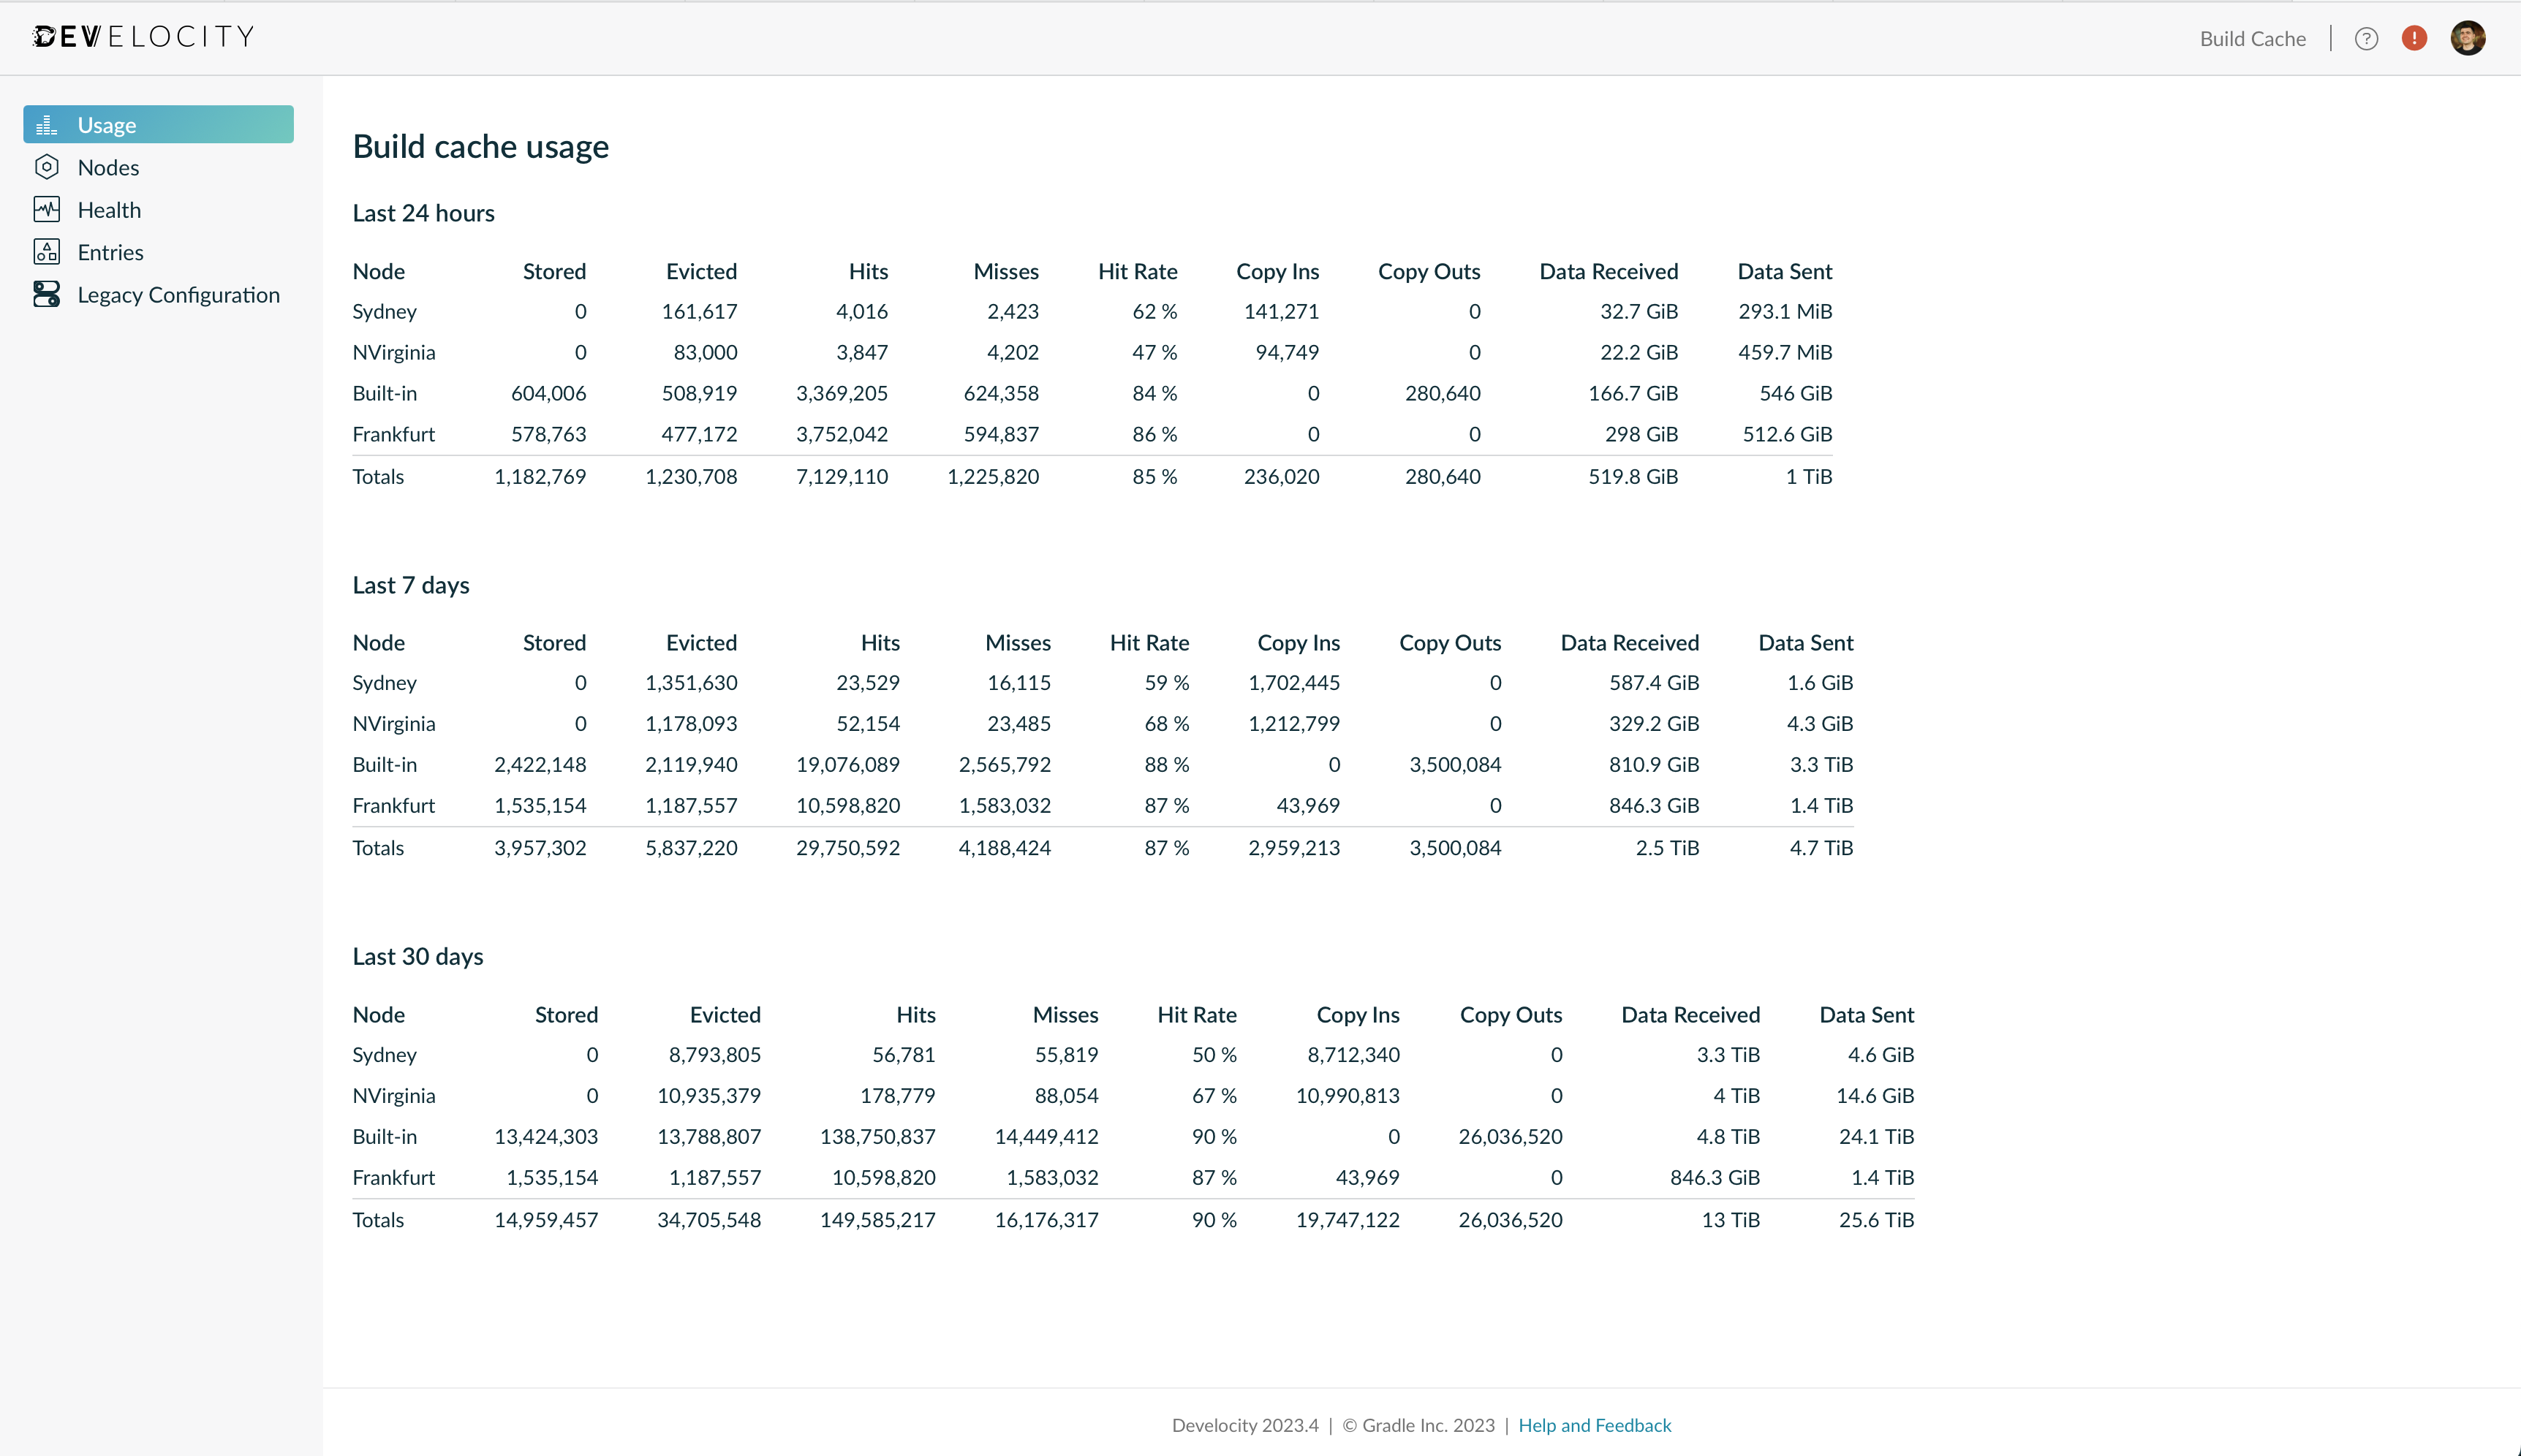
The exact numbers you see will depend on how many cacheable tasks your build executed. In order for a task to be cacheable, it must be designed with certain considerations and must declare itself to be cacheable. Many of Gradle’s built-in tasks are cacheable, and increasingly many tasks from third-party community plugins are cacheable.
Remote Build Cache nodes
Build Cache nodes are the Build Caches that Gradle builds connect to. Develocity provides a built-in node at https://develocity.example.com/cache, as we have seen. You can install additional “remote” nodes, potentially on different servers, and connect them with Develocity.
Different projects may produce and reuse task outputs at different rates. As Build Caches are limited in size, with least recently used items being evicted to make space, a project that produces many outputs and is frequently changing may undesirably dominate the Build Cache and result in a low cache hit rate for other projects. Distributing projects across Build Cache nodes may yield higher hit rates.
The effectiveness of using a remote Build Cache is largely dictated by the speed of network communication between the build and the Build Cache. Using a Build Cache node that is closer to where the builds are run, or that otherwise has a better network connection to it, may reduce build times by reducing network transfer times.
The Develocity Admin Manual details how to install and configure remote nodes.
Configuration
Nodes can be configured by going to https://develocity.example.com/cache-admin and navigating to the Nodes page.
In particular, consider increasing the Build Cache size from the default of 1 GiB to something in the 10s of GiB. The larger the Build Cache, the more it can store, which may increase your cache hit rate.
Next steps
Learning more about the Build Cache
Reading the dedicated Build Cache Guide is strongly recommended. This guide provides detailed information about build caching in general, including considerations for using it in practice. It also covers how to debug and optimize Build Cache usage using Build scans.
Planning a roll out
The best roll out strategy depends on your circumstances. A common strategy however is to first enable Build Cache usage only for CI builds, then later enabling for local development builds. The Build Cache configuration within a build can be specified dynamically, supporting this kind of usage. Examples of different kinds of configuration patterns are available in the Gradle User Guide.
Enabling Build Scans for any build using the remote Build Cache should be considered a prerequisite. Build Scan insights make it considerably easier to debug and optimize Build Cache usage.
Getting help or asking questions
If you are currently using Develocity as part of your trial sign-up or license purchase, you will have received instructions on how to access the priority Develocity support channel. If you have any issues with or questions about Develocity, please raise a support request.
Alternatively, or if you are not yet using Develocity, you can use the Gradle discussion forum if you are able to discuss your issue publicly. If you are unable to discuss your issue publicly, please use our contact form.
Keeping up to date
Gradle and Develocity are constantly evolving with regular updates that add new features and capabilities. The monthly Gradle newsletter is an easy way to stay informed about new releases, features and Gradle events.