---
component: reporting-kit
version: "2.2"
slug: reporting-kit/index
canonical_url: "https://docs.gradle.com/develocity/reporting-kit/2.2/"
title: "Develocity Reporting Kit Installation Manual"
description: "Learn how to install and configure the Develocity Reporting Kit to get insights about your Develocity build data."
keywords: []
status: current
---
> Canonical:
# Develocity Reporting Kit Installation Manual
> [!NOTE]
> You are viewing the documentation for the Reporting Kit version 2.0. If you are upgrading from 1.x, please see Upgrading from 1.x to 2.x.
* * *
## Introduction
This manual provides instructions for visualizing Develocity build data by installing the Develocity Reporting Kit into a Kubernetes cluster or onto a standalone host.
> [!NOTE]
> If you are looking to visualize Develocity build data in an AWS-hosted setup by using AWS-provided services, you can do that by using AWS S3 and AWS Athena.
The Develocity Reporting Kit (also known as the Reporting Kit) is a Kubernetes-based application, distributed as a [Helm](https://helm.sh/) chart. Helm is a package manager for Kubernetes applications. [Helm](https://helm.sh/docs/intro/using_helm/) manages all Develocity Reporting Kit components.
The Reporting Kit is a companion application to a [Develocity](https://gradle.com/develocity/) installation, and is only useful for existing Develocity customers or those trialling Develocity.
### Build Data
A Build Scan® is a persisted record of a single build’s captured data. Each Build Scan consists of thousands to millions of very fine-grained events. Build models aggregate these events into higher-level structures to expose easily consumable, summarized information about the build.
Build models can be consumed via the [Develocity API](https://docs.gradle.com/develocity/2026.1/reference/develocity-api/). This guide focuses on installing the Reporting Kit and connecting it to the API of an existing Develocity installation.
> [!TIP]
> The [`builds` endpoint of the Develocity API](https://docs.gradle.com/develocity/2026.1/reference/develocity-api/#reference_documentation) serves the build models that are available to the Reporting Kit.
### Prerequisites
#### 1. Develocity Installation
The Reporting Kit pulls build model data from an existing Develocity installation. To install the Reporting Kit you will need:
* The URL of the Develocity installation. See [Installing Into the Same Kubernetes Cluster as Develocity](#same_cluster) if deploying into the same Kubernetes cluster as Develocity.
* Your Develocity license file.
* An access key for an account on that instance with the [necessary permissions](#develocity_access_key).
> [!IMPORTANT]
> The Reporting Kit can visualize Build Scan data from a Develocity instance of version 2023.4 or later. Some built-in dashboards rely on data available in later Develocity versions. See the compatibility table for details.
#### 2. Build Environment
Most of the built-in dashboards rely on the presence of specific [tags](https://docs.gradle.com/develocity/gradle/4.4/gradle-plugin/#adding_tags) and [custom values](https://docs.gradle.com/develocity/gradle/4.4/gradle-plugin/#adding_custom_values) on Build Scan data to render the desired visualizations.
Tags used within the dashboards:
1. `CI` - Used throughout the dashboards to classify builds as either CI (tag is present) or local (tag is absent) builds
Custom values used within the dashboards:
1. `Git repository` - The URI of the Git repository that the build was run in, e.g., `git@github.com:gradle/gradle.git`
2. `CI provider` - The name of the CI provider that ran the build, e.g., `GitHub Actions`
> [!TIP]
> If you are using the [Common Custom User Data Gradle plugin](https://github.com/gradle/common-custom-user-data-gradle-plugin), [Common Custom User Data Maven extension](https://github.com/gradle/common-custom-user-data-maven-extension) or [Common Custom User Data sbt plugin](https://github.com/gradle/common-custom-user-data-sbt-plugin), this information will be automatically added to every Build Scan.
## Host Requirements
This section outlines the requirements for installing the Develocity Reporting Kit.
### 1. Kubernetes Cluster
The Reporting Kit must be installed into a running Kubernetes cluster. The cluster you install the Reporting Kit into needs to have access to sufficient [resources](#resource_requirements). Your cluster should be running a [recent version of Kubernetes](https://kubernetes.io/releases/) that’s still receiving patch support.
It’s also possible to install the Reporting Kit on a single node using the [K3s](https://k3s.io/) lightweight Kubernetes distribution. Installation instructions are provided below.
We don’t recommend installing the Reporting Kit into the same standalone K3s cluster as Develocity, due to competition for resources. See [the appendix](#same_cluster) if you are considering this.
### 2. Kubernetes Platforms
The Develocity Reporting Kit doesn’t use any platform specific features and is expected to work on all platforms, but we haven’t verified every available platform.
We’ve verified that the Reporting Kit works on [K3s](https://k3s.io/) and [Amazon EKS](https://aws.amazon.com/eks/).
### 3. Helm Requirements
Check the [Helm Version Support Policy](https://helm.sh/docs/topics/version_skew/) to ensure compatibility with your Kubernetes version.
### 4. Resources
#### Node Group Specification
If you are planning to provision a dedicated cluster for your Develocity Reporting Kit installation, our recommended node group specification for that cluster is 2 nodes, each with **4 CPU units** and **40 GiB memory**.
#### Resource Requests and Limits
If you are planning to install the Reporting Kit in an existing cluster, we recommend ensuring access to at least **6 [CPU units](https://kubernetes.io/docs/tasks/configure-pod-container/assign-cpu-resource/#cpu-units)** and **64 GiB memory**.
The Develocity Reporting Kit Helm Chart’s total [resource requests and limits](https://kubernetes.io/docs/concepts/configuration/manage-resources-containers/#requests-and-limits) are:
* Resource requests (the minimal resources required by the application to start): **4.75 CPU units**, **50.44 GiB memory**.
* Resource limits (the maximum resources that might be used by the application if available): **30.5 CPU units**, **55.93 GiB memory**.
#### Single-Node Installation
If you are planning to install the Develocity Reporting Kit on a single node, then that machine should meet these minimum requirements:
* **8** CPUs (`x86_64` architecture)
* **64 GiB** of memory
### 5. Storage
The Develocity Reporting Kit uses [persistent volume claims](https://kubernetes.io/docs/concepts/storage/persistent-volumes/#persistentvolumeclaims) for storing data. You can optionally provide the name of the desired storage class to be used for provisioning persistent volumes.
Some Pods are associated with persistent volumes and for Kubernetes platforms with multiple availability zones, the Pods and their persistent volumes must be located in the same zone. In this case it’s recommended to use a storage class with a `volumeBindingMode` of `WaitForFirstConsumer` to ensure that all persistent volumes are provisioned in the same zone that the Pod was scheduled in.
It’s strongly recommended to use storage classes that allow [persistent volume claim expansion](https://kubernetes.io/docs/concepts/storage/persistent-volumes/#expanding-persistent-volumes-claims) if available. This makes it straightforward to expand the storage used by the Reporting Kit.
#### Capacity Recommendations
The recommended minimum capacities for the persistent volumes are:
| Description | Size in GiB |
| --- | --- |
| MinIO | 100 |
| Hive metastore | 10 |
Exact [MinIO](https://www.min.io/) storage requirements vary greatly depending on the number and size of Build Scans stored in your Develocity instance. We recommend monitoring the available space in your MinIO volume to ensure that your system doesn’t run out of space.
If your storage class doesn’t allow expanding volumes, you should also consider preparing for future data growth by adding additional disk capacity upfront.
## Helm Configuration
The Develocity Reporting Kit is a Kubernetes-based application, distributed as a [Helm](https://helm.sh/) chart. Helm is a package manager for Kubernetes applications, and it manages all Develocity Reporting Kit components. A Helm chart is a Kubernetes manifest template, with variables that can be provided at installation time.
### Providing Configuration to Helm
Helm uses a `values.yaml` file to populate these variables and generate the Kubernetes manifests.
The variables in `values.yaml` configure the Develocity installation with information such as networking, database, or hostname settings.
Here is a minimal sample `values.yaml` file for installing the Develocity Reporting Kit:
**values.yaml:**
```
develocity:
address: https://develocity.example.com
accessKey: "aecitwnpfw7h2sp3bl5uhrk5yedk47756obrsmneevvfe6jo2ssa"
```
Helm configuration can be provided in several ways:
* Creating a Helm values file and passing it to `helm` using `--values`.
* Passing values directly to the `helm` command using `--set` or `--set-file`.
* Editing the default Helm values file in the chart before running `helm`.
We generally recommend setting values in a `values.yaml` file, because it means that your configuration is all in one place, and you have a more straightforward command to run for installation and upgrades.
Once your `values.yaml` file is complete, you will install the Reporting Kit using a command similar to the one below:
```shell
helm install --values ./values.yaml
```
> [!NOTE]
> Unless otherwise indicated, most values are optional and have usable defaults.
### User-Managed Secrets
The Develocity Reporting Kit allows you to configure several secret values for various purposes described [below](#helm_options). The Reporting Kit’s Helm chart allows you to set secret values directly in Helm configuration. In this case, Helm will create the Kubernetes Secret which contains the secret value. As an alternative, it’s usually possible in the Reporting Kit’s Helm chart to set the secret value in a Kubernetes Secret that you create and manage independently of Helm. If you use such a _user-managed_ secret, you need to provide Helm with the name of the secret you have created for that purpose.
For example, if you want to configure the Grafana editor password using a user-managed secret, then you would create a secret (for example, using [kubectl](https://kubernetes.io/docs/tasks/configmap-secret/managing-secret-using-kubectl/#create-a-secret)), take a note of the name, and then add it to your Helm values file using a prescribed Helm value.
For different secret values which the Reporting Kit’s Helm chart allows to be configured using a user-managed secret, you will need to use a different, specific Helm value, typically of the form `some.thing.secretName`. In this example, for the Grafana admin password, the Helm value to use is `grafana.editorAccount.secretName`. Wherever a user-managed secret can be used to configure a secret value, the [data items](https://kubernetes.io/docs/tasks/configmap-secret/managing-secret-using-config-file/#create-the-config-file) that the secret needs to contain will be mentioned in the same place where the configuration of that secret value is documented.
### Recommended Values
Here is a sample `values.yaml` file for installing the Develocity Reporting Kit:
**values.yaml:**
```
# Target Develocity server
develocity:
address: https://develocity.example.com
accessKey: "aecitwnpfw7h2sp3bl5uhrk5yedk47756obrsmneevvfe6jo2ssa"
# Optionally create an editor account capable of creating custom dashboards
grafana:
editorAccount:
username: "editor"
password: "showmethedata1234"
# Set the MinIO storage capacity a bit higher than the default
minio:
storage:
capacity: 200Gi
```
### Deterministic Helm Template Output
If you use tools that redeploy applications based on changes in the output of `helm template`, such as ArgoCD, then you may need to ensure that the output of `helm template` is deterministic based on the Helm values you provide. To achieve this, read [the appendix of this manual covering deterministic Helm output](#deterministic_helm_output).
## Helm Options
Each section below contains an overview of Develocity Reporting Kit installation options and their corresponding `values.yaml` variables:
1. Global options (license, images, annotations, storage class, security context, trusted certificates)
2. Develocity configuration
3. Pod resources
4. Access control
5. Ingress configuration
6. Scaling
7. Query results cache
### 1. Global Options
#### Configuration for Pulling Images Into the Installation Cluster
In order to pull images from the Gradle registry at [https://registry.gradle.com/](https://registry.gradle.com/), you need to provide your Develocity license file to Helm at installation time when installing the Reporting Kit. This is the same license file as the one used for your Develocity installation. The easiest way to do this is to pass `--set-file global.license.file=/path/to/develocity.license` as an argument when running `helm install`.
You can also provide the license file inline in the values file. Only the "data" portion of the license is needed in the Helm value file, but it’s acceptable to include the entire license file contents:
**values.yaml:**
```
global:
license:
file: R0VMRgF4nBWOSZKCMAAAX+QUu3BUIJAIwUQiwsViEwMIDKOyvH701n3p6nJBYxoRHnAUnwHwKLjb...
```
It’s also possible to specify the `imagePullSecret` using a [user-managed secret](#user-managed-image-pull-secret).
##### Using a User-Managed Secret for Pulling Images
To manually create a secret containing the Develocity license within the same namespace as the Develocity Reporting Kit, follow these steps:
Create a namespace for the Develocity Reporting Kit, if it doesn’t already exist:
```shell
kubectl create namespace develocity-reporting-kit (1)
```
1. This example uses develocity-reporting-kit as the namespace, but it can be a custom name. If you use a custom name, update following commands accordingly.
Create a `docker-registry` secret with the Develocity license:
```shell
kubectl -n develocity-reporting-kit create secret docker-registry my-develocity-license-image-pull-secret \(1)
--docker-username=develocity \
"--docker-password=$(cat path/to/develocity.license)" \
--docker-server=registry.gradle.com
```
1. my-develocity-license-image-pull-secret is the name of the secret. It can be any name you choose.
In your values.yaml file, be sure to include the name of the specific secret you want to use within the `imagePullSecret` key:
**values.yaml:**
```
global:
image:
imagePullSecret: my-develocity-license-image-pull-secret
```
##### Airgap Installation Image Pull Policy
In a K3s-based [airgap installation](#airgap) onto a standalone host, Helm should be configured so that no attempt is made to pull images from the outside world with the values below:
**values.yaml:**
```
global:
image:
imagePullPolicy: Never
```
This is because in a K3s-based standalone airgap installation, you [import images onto the K3s node directly](#airgap_import_images), rather than pulling them from a registry.
#### StorageClass
The same StorageClass is used for all persistent volume claims. It can be configured by setting the Helm value `global.storage.data.class`.
#### Pod Annotations
Pod annotations for all Pods can be configured by setting the Helm value `global.podAnnotations`.
#### Security Context
By default, all Pods are created with a security context defining a non-root user for the containers to run as. This is our most tested configuration, and it’s secure, so you should leave this enabled if you can. In some environments, most notably in OpenShift clusters, these may need to be disabled for the application to run correctly. This can be done by setting the Helm value `global.securityContext.enabled` to false.
#### Trusted TLS Certificates
By default, the Develocity Reporting Kit uses the default trust settings of the Java runtime that it ships with when connecting to other systems using TLS. If you use an internal Certificate Authority (CA), you may need to provide additional TLS certificates for the Reporting Kit to trust. You only need to add additional TLS certificates if these are necessary to connect to Develocity.
To specify custom trusted TLS certificates for the Reporting Kit, set the Helm value `global.network.additionalTrust` to the contents of a file containing X509 certificates in PEM format, newline separated if there are more than one. An example is shown below:
**values.yaml:**
```
global:
network:
additionalTrust: |
-----BEGIN CERTIFICATE-----
MIIDlzCCAn+gAwIBAgIUS098FlRZcuXLeXBhnf40E9WjtWQwDQYJKoZIhvcNAQEL
...
+W892fTw2irGwfg=
-----END CERTIFICATE-----
-----BEGIN CERTIFICATE-----
MIIDfzCCAmegAwIBAgIURqPslYGu7cHXs22q3RK6e5L87PwwDQYJKoZIhvcNAQEL
...
s10yB5VjVBES6A22rYwYb8mImpQiVP/mr4ao5U5m+h50l3E=
-----END CERTIFICATE-----
```
Alternatively, you can set this value by passing the argument `--set-file global.network.additionalTrust=/path/to/trusted-certificates.pem` when running `helm install`.
### 2. Develocity Configuration
The Develocity Reporting Kit requires an authorized connection to a Develocity instance in order to pull builds. This connection can be configured by setting the values `develocity.accessKey` and `develocity.address`.
If you’d prefer to manage the access key secret yourself, you can do so by setting `develocity.accessKey.secretName` instead of `develocity.accessKey`. The secret named by this value should contain a single item of data, `accessKey`, which should be set to a base64 encoded Develocity access key that has the [correct Develocity permissions](#develocity_access_key).
#### Develocity Access Key
The Reporting Kit must be configured with an access key associated with an account that has the _Access build data via the API_ permission. This permission is `exportData` in a [Develocity unattended config file](https://docs.gradle.com/develocity/2026.1/administration/unattended-configuration/).
See the [Admin Manual](https://docs.gradle.com/develocity/2026.1/administration/access-control/) for more details on access control and permissions, and the [API User Manual](https://docs.gradle.com/develocity/2026.1/reference/develocity-api/#access_control) for more on access key provision and verifying user granted permissions.
#### Limiting Communication With Develocity
Currently, the only way to limit the amount of data that the Reporting Kit pulls from Develocity is to scale down the `data-synchronizer` deployment to 0 replicas. This will prevent any additional data from being pulled. To scale the data-synchronizer down, run the following command:
```shell
kubectl -n develocity-reporting-kit scale deploy data-synchronizer --replicas=0
```
### 3. Pod Resources
#### Memory and CPU
The resource requests and limits for each container of each Pod can be controlled using Helm values. Init containers, where they’re present, use the same resource requests and limits from an appropriate non-init container. The pattern for configuring these resources is to use the Helm values `.resources.limits.cpu`, `.resources.limits.memory`, `.resources.requests.cpu`, `.resources.requests.memory`, where `` is any of:
* `dataSynchronizer`
* `grafana.main`
* `grafana.accountInitializer`
* `hiveMetastore.main`
* `hiveMetastore.postgres`
* `minio`
* `trino.coordinator`
* `trino.worker`
* `trino.cache`
#### Storage
* `minio.storage.capacity` configures the amount of storage available to MinIO for storing Build Scan data.
* `hiveMetastore.storage.capacity` configures the amount of storage available for storing partition metadata by the hive metastore. We don’t expect this to be very large ordinarily, so you should use the default value unless directed to change it by a member of the Gradle support team.
* `grafana.storage.capacity` configures the amount of storage available to the Grafana’s embedded database. We don’t expect this to be very large ordinarily, so you should use the default value unless directed to change it by a member of the Gradle support team.
These values need to be provided in the format of a [Kubernetes storage size](https://kubernetes.io/docs/concepts/configuration/manage-resources-containers/#meaning-of-memory).
#### Ephemeral Storage
Ephemeral container storage is used by [Trino](https://trino.io/) pods for their file cache when processing SQL queries.
> [!IMPORTANT]
> We recommend that you change these values only if instructed to do so by a member of the Gradle support team.
* `trino.fileSystemCache.size` configures the size of the file cache used by Trino nodes for processing SQL queries. A value of `0` disables the cache.
> [!CAUTION]
> When modifying this value, you must also correspondingly modify the ephemeral storage request and limit values for both the Trino coordinator and the worker. Otherwise, Trino pods might get evicted due to exceeding their ephemeral storage limits.
* `trino.[coordinator|worker].resources.requests.ephemeralStorage` configures the minimum amount of ephemeral container storage required in order for Trino coordinator or worker containers to be scheduled.
* `trino.[coordinator|worker].resources.requests.ephemeralStorage` configures the maximum amount of ephemeral container storage Trino coordinator or worker containers can consume.
If you disable the cache by configuring a `cacheSize` of `0`, Trino’s ephemeral storage consumption will be negligible. In that case it’s recommended to also set the coordinator’s and worker’s ephemeral storage request value to `0` and the limit to `100Mi`.
### 4. Access Control
A few components in the Develocity Reporting Kit use credentials, and these can be configured using Helm values.
#### Grafana
The frontend of the Reporting Kit is an embedded Grafana service, which displays the visualizations of the build data.
If you want to enable anonymous access to view the dashboards, set `grafana.anonymousAccess` to `true`. Otherwise, you should configure either a viewer or an editor account to access the dashboards as describe below.
##### Grafana Viewer Account
The Reporting Kit supports optionally creating a single, shared viewer account. This is a read-only account which is only allowed to view dashboards but not to run queries using Grafana’s _Explore_ view or to create new dashboards. To create a viewer account, set `grafana.viewerAccount.username` and `grafana.viewerAccount.password`.
You can also instead configure the viewer user’s username and password using a [user-managed secret](#user-managed-secrets). Set `grafana.viewerAccount.secretName` to point to the secret, which must have two data items, `user` and `password`.
##### Grafana Editor Account
The Reporting Kit supports optionally creating a single, shared editor account. In addition to viewing the bundled dashboards, this account can also create new dashboards for custom visualizations. To create an editor account, set `grafana.editorAccount.username` and `grafana.editorAccount.password`.
You can also instead configure the editor user’s username and password using a [user-managed secret](#user-managed-secrets). Set `grafana.editorAccount.secretName` to point to the secret, which must have two data items, `user` and `password`.
##### Grafana Admin Account
The admin account for the Reporting Kit’s embedded Grafana instance always has the username `admin`. You can configure the password for the admin account by setting the Helm value `grafana.adminAccount.password`. You can also use a [user-managed secret](#user-managed-secrets), by setting `grafana.adminAccount.secretName` to the name of a secret containing a single data item, `password`.
#### Trino
##### Trino User Account
The Trino user account is used by the Reporting Kit when executing queries. By default, secure credentials are randomly generated in a Kubernetes Secret during templating. You can configure the user account credentials directly using the following configuration:
**values.yaml:**
```
trino:
userAccount:
credentials:
type: basic
basic:
user: (1)
password: (1)
# Or
secretName: (2)
```
1. You can set the user and password for Trino inline.
2. Alternatively, you can set Trino credentials using a user-managed secret containing two data items, `user` and `password`.
> [!NOTE]
> In order to use the [Trino query access feature](#trino_query_access), you must configure Trino user account credentials either inline or using a user-managed secret.
##### Trino System Account
The Trino system account is used by the Reporting Kit for inserting and compacting data, managing data partitions, and managing the schema. By default, secure credentials are randomly generated in a Kubernetes Secret during templating. You can configure the system account credentials directly using the following configuration:
**values.yaml:**
```
trino:
systemAccount:
credentials:
type: basic
basic:
user: (1)
password: (1)
# Or
secretName: (2)
```
1. You can set the user and password for Trino directly.
2. Alternatively, you can set Trino credentials using a user-managed secret containing two data items, `user` and `password`.
#### Data Visibility Compared to Develocity
> [!WARNING]
> All Develocity data that’s sent to the Develocity Reporting Kit will be visible to all authenticated users of the Reporting Kit. Data visibility in the Reporting Kit isn’t controlled according to Develocity’s configuration for project-level access control, so you should only give credentials for the Reporting Kit to people who are authorized to view Build Scan data across all the projects configured in the Develocity instance from which the Reporting Kit is configured to pull build models.
### 5. Ingress Configuration
By default, the Develocity Reporting Kit Helm chart will create a Kubernetes Ingress to serve inbound traffic to the app. If you want to disable the default Ingress in order to use some other routing solution provided by your cluster, set `ingress.enabled` to `false`. The Ingress created by the Helm chart will in this subsection be referred to as the _Helm-managed Ingress_.
#### Hostname
By default, the Helm-managed Ingress isn’t restricted to a single hostname, and will attempt to route traffic for all hosts to the Reporting Kit. If deploying in a cluster with other applications installed, you can set `ingress.hostname` to only route traffic for a single host through to the Reporting Kit.
#### Customizations
You can provide additional Kubernetes resource annotations to be set on the created Ingress. This is done by setting key-value pairs under the Helm value `ingress.annotations`, in the same way as is described for Ingress annotations in the [Develocity Helm Chart Configuration Guide](https://docs.gradle.com/develocity/2026.1/reference/helm-charts/cluster/#grpc_with_ingress_annotations).
By default, the created Ingress will use the default Kubernetes Ingress class provided by the Kubernetes cluster. If you want to override this to use a specific, fixed Ingress class, then set the Helm value `ingress.ingressClassName` to the name of the Ingress class you’d like to use.
The default `pathType` for the created Kubernetes Ingress is `Prefix`. If you need to instead use the path matching implementation provided by the Ingress class, then set the Helm value `ingress.pathType` to `ImplementationSpecific`.
#### TLS
By default, the Helm-managed Ingress will use plain HTTP only.
To enable HTTPS support, set `ingress.ssl.enabled` to `true` and provide a hostname for your installation by setting the Helm value `ingress.hostname`. By default, if HTTPS support is enabled, the Helm chart will generate and use self-signed SSL certificates. If instead you want to provide custom SSL certificates, for example ones signed by your own internal Certificate Authority, then you can do so by providing the SSL certificate and SSL key as Helm values. This can be done by passing `--set-file ingress.ssl.key=/path/to/key/file --set-file ingress.ssl.cert=/path/to/cert/file` to Helm when running the [installation command](#helm_install_command), or by providing them inline in the values file as shown below:
**values.yaml:**
```
ingress:
ssl:
enabled: true
cert: |
-----BEGIN CERTIFICATE-----
MIIDKjCCAhKgAwIBAgIRAPNTIHf6/oUuzMKm3ffGNOgwDQYJKoZIhvcNAQELBQAw
HDEaMBgGA1UEAxMRYXV0by1nZW5lcmF0ZWQtY2EwHhcNMjExMTMwMTU1NDU5WhcN
...
Cn/3yUirFVTslrSYKAemLw8btLO6FDF9dc/lq1o7tKsYVuhEcjqnTah7puJjEN9h
z+P5RmRxU/kaaFB+Vuw1pRezbaAtZNorVgXnBwrdseY4zLGyhAcGcR9v+VtCiQ==
-----END CERTIFICATE-----
key: |
-----BEGIN RSA PRIVATE KEY-----
MIIEpQIBAAKCAQEA4qV8JlqDMi7y85Ykq8dn7uIsi609D6KuFtlc+UvNYjatz0+u
QzIr3iw//qf7sM8nx8fhGwuWvUWeCE6zbgKjuxDH82J9NQ0ctf70n0qVTeyW1CKR
...
XlOfXr/xvkXA66PROgvVxfwpN/GNrLXFi1HvMg7MVZJUZQpNzpAzw5JTk2MbawOl
G7tI0qQ6F20e5R4tPpEDKCFZykyvgGMhfLzsvVlrgaVW8QbVK4YWNtQ=
-----END RSA PRIVATE KEY-----
```
You can also use a [user-managed secret](#user-managed-secrets) for the SSL key and certificate. This secret should be a [Kubernetes TLS Secret](https://kubernetes.io/docs/concepts/configuration/secret/#tls-secrets), and the name of the secret needs to be provided in the Helm value `ingress.ssl.secretName`.
### 6. Scaling
The number of Trino workers used to process SQL queries can be configured using the Helm value `trino.worker.replicas`. For most installations we recommend using the default value, _1_.
### 7. Query Results Cache
See [Query Result Caching](#query_result_caching) for more details about the query results cache.
* `trino.cache.defaultRetention` configures the duration for which query results will be cached. A value of `0` disables the cache. The default is `1d`.
* `trino.cache.purgeInterval` configures the frequency with which expired cache entries will be removed from the file system. It defaults to `1d`.
### 8. Trino
There are Helm values for configuring details of the embedded Trino query engine included with the Reporting Kit, however you shouldn’t adjust the defaults, unless advised to do so by Gradle support.
* `trino.maxHttpContentLength` configures a maximum content length for data transferred within the cluster while processing queries. You only need to adjust this if you notice dashboards failing with an error such as `error querying the database: Remote page is too large`. The default value is `64MB`.
* `trino.queryMaxRunTime` configures the maximum allowed time for a query to be processed on the cluster, before it’s terminated. The time includes time for analysis and planning, but also time spent in a queue waiting, so essentially this is the time allowed for a query to exist since creation. See [the relevant Trino documentation](https://trino.io/docs/current/admin/properties-query-management.html#query-max-run-time).
#### Query Trino From Outside the Cluster
By default, the Develocity Reporting Kit uses an embedded Grafana instance for visualizing developer productivity metrics based on the downloaded build data. However, you can configure the Reporting Kit so that you can directly query the embedded Trino query engine via a Kubernetes Ingress. This makes it possible for you to [visualize the data using your own user-managed Grafana instance](#user_managed_grafana_config), or even another visualization tool managed by you.
> [!NOTE]
> Presently we don’t provide any additional support for visualizing build data using a visualization tool other than Grafana. You can nevertheless connect other tools to Trino and create your own dashboards using the available build model data. Contact Gradle support if you need help setting this up.
To configure Trino to be accessible from outside the Kubernetes cluster, you need to make sure your configuration meets [the necessary prerequisites](#trino_query_access_configuration_prerequisites), and set `trino.ingress.enabled` to `true`.
By default, Trino is accessible over the default Kubernetes Ingress created for the Reporting Kit, at the root path, '/'.
Once configured, you can connect to an instance using a Trino client that uses the HTTP interface, or by using the Trino JDBC driver.
Here’s how you can connect using the Trino CLI:
```shell
export TRINO_PASSWORD=super-secret
# Note: Add the flag --insecure if you're using self-signed certificates.
trino "https://develocity-reporting-kit.example.com" --user=trino --password
```
##### Prerequisites
To enable Trino query access, you must configure [Trino user account credentials](#trino_user_account_credentials).
You must also [enable ingress SSL and set an ingress hostname](#ingress_ssl).
##### Using a Dedicated Hostname for Trino Query Access
It’s possible to configure Trino to be queryable via its own dedicated Kubernetes Ingress, rather than using the Reporting Kit’s default Ingress.
To do this, set `trino.ingress.hostname` to the hostname you want to access Trino over. You will need to create appropriate DNS records in order for this to work.
You can customize aspects of this dedicated ingress using the below values. To avoid unexpected misconfiguration, attempting to set any of these values without setting `trino.ingress.hostname` will throw an error during templating, because they have no effect unless it’s set.
The dedicated Trino ingress always uses TLS and this currently cannot be disabled. By default, the Helm chart will generate and use self-signed SSL certificates. If instead you want to provide custom SSL certificates, for example ones signed by your own internal Certificate Authority, then you can do so by providing the SSL certificate and SSL key as Helm values. This can be done by passing `--set-file trino.ingress.ssl.key=/path/to/key/file --set-file trino.ingress.ssl.cert=/path/to/cert/file` to Helm when running the [installation command](#helm_install_command), or by providing them inline in the values file as shown below:
**values.yaml:**
```
trino:
ingress:
ssl:
cert: |
-----BEGIN CERTIFICATE-----
MIIDKjCCAhKgAwIBAgIRAPNTIHf6/oUuzMKm3ffGNOgwDQYJKoZIhvcNAQELBQAw
HDEaMBgGA1UEAxMRYXV0by1nZW5lcmF0ZWQtY2EwHhcNMjExMTMwMTU1NDU5WhcN
...
Cn/3yUirFVTslrSYKAemLw8btLO6FDF9dc/lq1o7tKsYVuhEcjqnTah7puJjEN9h
z+P5RmRxU/kaaFB+Vuw1pRezbaAtZNorVgXnBwrdseY4zLGyhAcGcR9v+VtCiQ==
-----END CERTIFICATE-----
key: |
-----BEGIN RSA PRIVATE KEY-----
MIIEpQIBAAKCAQEA4qV8JlqDMi7y85Ykq8dn7uIsi609D6KuFtlc+UvNYjatz0+u
QzIr3iw//qf7sM8nx8fhGwuWvUWeCE6zbgKjuxDH82J9NQ0ctf70n0qVTeyW1CKR
...
XlOfXr/xvkXA66PROgvVxfwpN/GNrLXFi1HvMg7MVZJUZQpNzpAzw5JTk2MbawOl
G7tI0qQ6F20e5R4tPpEDKCFZykyvgGMhfLzsvVlrgaVW8QbVK4YWNtQ=
-----END RSA PRIVATE KEY-----
```
The following values for customizing the dedicated Trino ingress are also available, all of which are used in the same way as [the corresponding customizations for the standard ingress](#ingress_customizations): - `trino.ingress.annotations` - `trino.ingress.ingressClassName` - `trino.ingress.pathType`
#### Visualizing Data From a User-Managed Grafana Instance
Once you have set up your Reporting Kit installation to allow Trino query access, you can connect it to other visualization tools. Most notably, you can use your own user-managed Grafana instance.
We provide [a downloadable bundle](#user_managed_grafana_dashboards_download) which contains the dashboards used by the Reporting Kit, and an example datasource configuration file for use with the Reporting Kit’s Trino query engine.
In order for your user-managed Grafana instance to query the Reporting Kit’s Trino query engine, you’ll need to configure a Trino datasource in Grafana, using the [Trino datasource plugin for Grafana](https://grafana.com/grafana/plugins/trino-datasource/). This datasource needs to be configured with your Reporting Kit’s URL and your Trino credentials (the ones which you are [required to configure](#trino_query_access_configuration_prerequisites)). You can also provide TLS material to verify TLS connections between Grafana and Trino.
You can import the dashboards used by the Reporting Kit into your user-managed Grafana instance by using [Grafana provisioning](https://grafana.com/tutorials/provision-dashboards-and-data-sources/), the [Grafana API](https://grafana.com/docs/grafana/latest/developer-resources/api-reference/http-api/dashboard/), or otherwise. There’s detailed information about importing our dashboards into a user-managed Grafana instance in our [AWS-based Develocity Reporting and Visualization documentation](https://docs.gradle.com/develocity/reporting-aws/2.1/#import_dashboards).
You can disable the Reporting Kit’s embedded Grafana by setting `grafana.enabled` to `false`.
For information on which versions of Grafana are compatible with the dashboards we provide, see [Grafana dashboard compatibility](https://docs.gradle.com/develocity/2026.1/miscellaneous/compatibility/#develocity_reporting_and_visualization_grafana).
## Installation
In this section you will install the Develocity Reporting Kit on your host or cluster.
To install the Reporting Kit, commands will need to be executed on the installation host or on a host with connectivity to your Kubernetes cluster and to the internet.
### 1. Install K3s (If applicable)
If installing on a host rather than an existing cluster, first install K3s and make it available to the current user:
```shell
curl -sfL https://get.k3s.io | sh -
```
```shell
sudo chown $UID /etc/rancher/k3s/k3s.yaml
```
```shell
mkdir -p "${HOME}/.kube"
```
```shell
ln -sf /etc/rancher/k3s/k3s.yaml "${HOME}/.kube/config"
```
Verify that you can interact with the K3s cluster:
```shell
kubectl get namespace
```
The expected output should be similar to this:
**Output:**
```
NAME STATUS AGE
default Active 1h
kube-system Active 1h
kube-public Active 1h
kube-node-lease Active 1h
```
> [!TIP]
> For more information on K3s installation, see the K3s [Quick-Start Guide](https://docs.k3s.io/quick-start) and K3s [Installation](https://docs.k3s.io/installation).
### 2. Install Helm
The Develocity Reporting Kit requires **Helm version 3.13.x (or later)** to install.
It’s recommended to use the latest version available as this will have all known security vulnerabilities addressed. [This document](https://helm.sh/docs/topics/version_skew/) describes the maximum version skew supported between Helm and Kubernetes.
> [!TIP]
> For more information on installing Helm (including alternate installation approaches), see [Installing Helm](https://helm.sh/docs/intro/install/).
Install Helm with the following command:
```shell
curl -qs https://raw.githubusercontent.com/helm/helm/main/scripts/get-helm-3 | bash
```
### 3. Tell Helm About the Gradle Helm Repository
The Develocity Reporting Kit is distributed from the [Gradle Helm repository](https://helm.gradle.com/).
Add the Gradle Helm repository to your Helm installation and fetch its contents into the local cache:
```shell
helm repo add gradle https://helm.gradle.com/
```
```shell
helm repo update gradle
```
Verify that the Develocity Reporting Kit chart is accessible:
```shell
helm search repo develocity-reporting-kit
```
This will report the latest versions available for the two Develocity charts:
**Output:**
```
NAME CHART VERSION APP VERSION DESCRIPTION
gradle/develocity-reporting-kit 2.2.1 2.2.1 Official Develocity Reporting Kit
```
### 3. Install the Develocity Reporting Kit
Install the Develocity Reporting Kit:
```shell
helm install \
--create-namespace --namespace develocity-reporting-kit \(1)
develocity-reporting-kit \(2)
gradle/develocity-reporting-kit \(3)
--values values.yaml \(4)
--set-file global.license.file=./develocity.license (5)
```
1. This example uses develocity-reporting-kit as the namespace, but it can be a custom name. If you use a custom name, update all other example commands accordingly. Running with --create-namespace will create the namespace if it doesn’t already exist.The namespace option may not be required for OpenShift if oc login has been run and the active project for the current context is set.
2. This is the Helm release name. It’s used by Helm to identify the Develocity Reporting Kit installation.
3. The Helm chart to install. To install a specific version, use e.g. --version 2.2.1.
4. The Helm values file containing configuration values as described above.
5. The Develocity license file (if not already included in your values file).
### 4. Confirm That the Develocity Reporting Kit Is Running
At this point, it should be possible to see the Helm release installed:
```shell
helm --namespace develocity-reporting-kit list
```
**Output:**
```
NAME NAMESPACE REVISION UPDATED STATUS CHART APP VERSION
develocity-reporting-kit develocity-reporting-kit 1 2024-04-05 16:20:07.618596 +0800 +08 deployed develocity-reporting-kit-2.2.1 2.2.1
```
You can inspect the status of the Develocity Pods:
```shell
kubectl --namespace develocity-reporting-kit get pods
```
**Output:**
```
NAME READY STATUS RESTARTS AGE
grafana-5bd84f6bff-jhl8v 0/2 ContainerCreating 0 12s
trino-worker-79f8ddfdd8-k6fc6 0/1 Init:0/1 0 12s
trino-coordinator-7d8794689-jrqn6 0/1 Init:0/1 0 12s
data-synchronizer-8489cd7749-gxv8h 0/1 Init:0/2 0 12s
minio-7b9d87c4c7-tsqss 0/1 ContainerCreating 0 12s
hive-metastore-7bfc5977b8-vwzkf 0/2 ContainerCreating 0 12s
```
> [!NOTE]
> Sometimes containers will initially fail when they start up because other Pods they depend on aren’t ready yet. This is normal and expected. In Kubernetes applications, it’s idiomatic for containers to repeatedly attempt to start, crash, and be restarted by the Kubelet until their dependencies are ready, because this prevents wasted allocation of requested resources while dependencies are starting up.
Within several minutes all the Pods should have the status `Running`:
**Output:**
```
NAME READY STATUS RESTARTS AGE
minio-7b9d87c4c7-tsqss 1/1 Running 0 8m10s
grafana-5bd84f6bff-jhl8v 2/2 Running 0 8m10s
hive-metastore-7bfc5977b8-vwzkf 2/2 Running 2 (6m23s ago) 8m10s
trino-worker-79f8ddfdd8-k6fc6 1/1 Running 0 8m10s
trino-coordinator-7d8794689-jrqn6 1/1 Running 0 8m10s
data-synchronizer-8489cd7749-gxv8h 1/1 Running 0 8m10s
```
The Develocity Reporting Kit has a `/ping` endpoint, which you use to verify that the application is accessible from your computer.
Connectivity to the Develocity Reporting Kit installation can be tested by running the following command on machines which need to connect to it:
```shell
curl -sw \\n --fail-with-body --show-error «develocity-reporting-kit-origin»/ping
```
This should show the text `SUCCESS`.
Once all Pods have a status of `Running` and the system is up and connected, you can interact with the Develocity Reporting Kit instance by visiting its address in a web browser. The root path of the Reporting Kit application is currently a generic Grafana landing page. If you navigate to the `/dashboards` path, you should be able to see a list of dashboard folders containing different dashboards for you to explore.
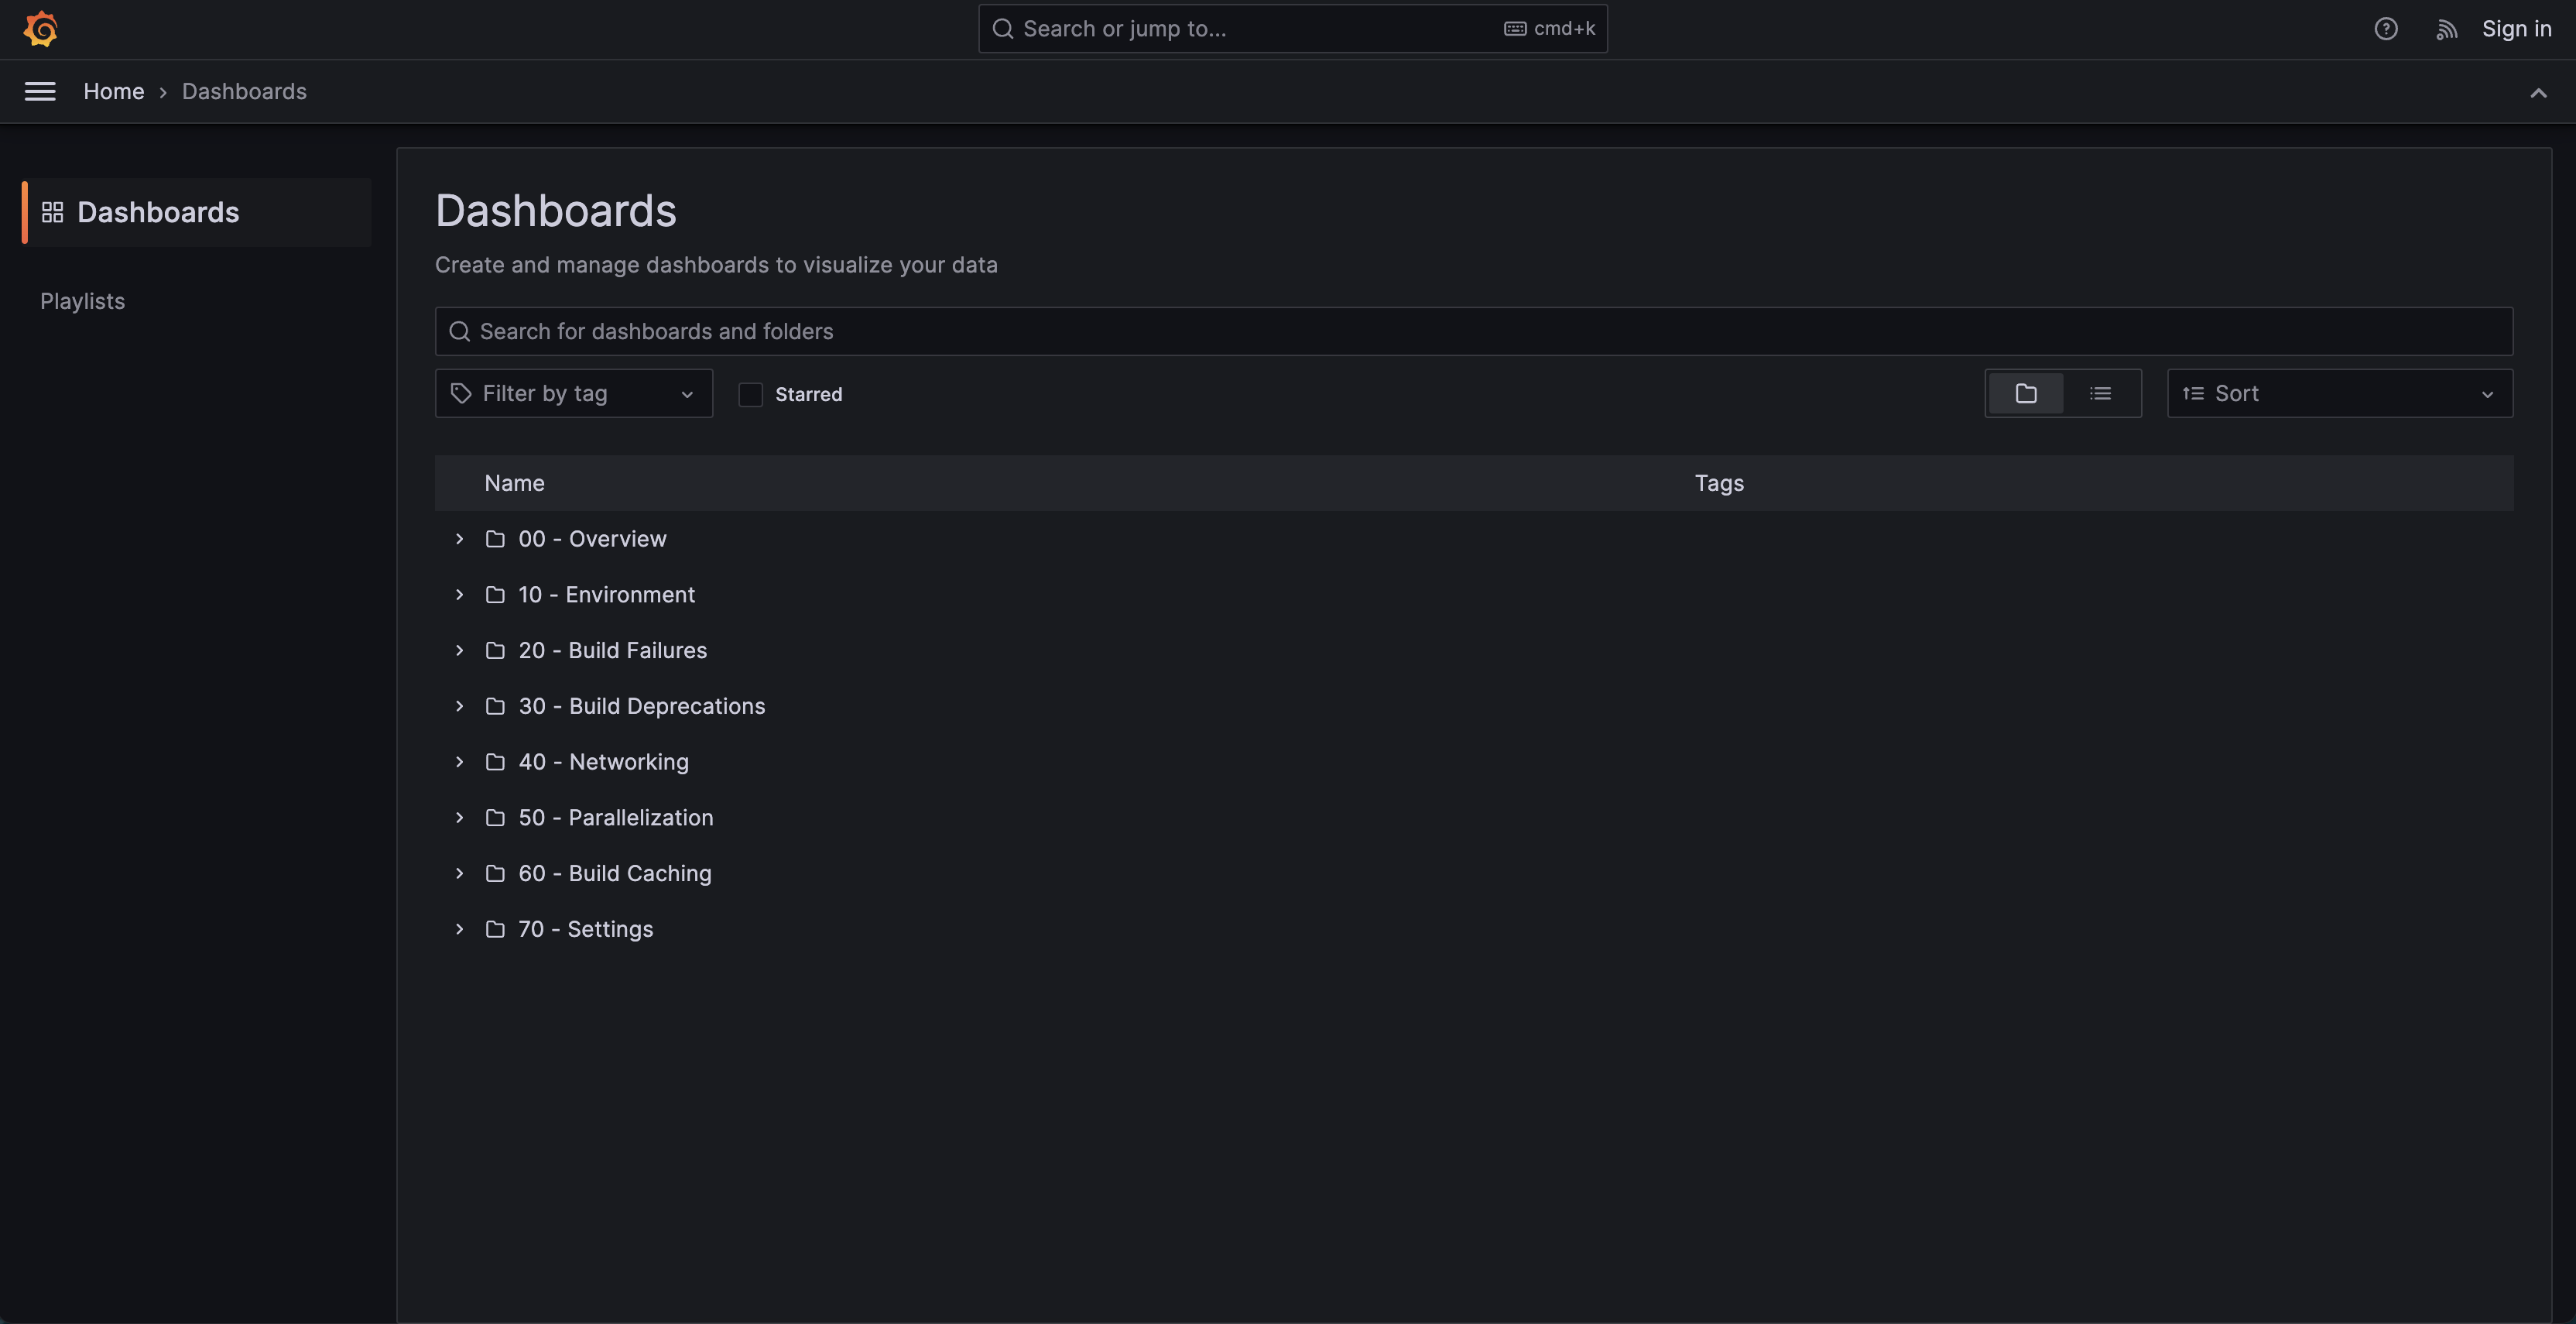
Dashboards Listing Page
Within 10 minutes of the instance being up and running, data from your Develocity instance should have started to get synced to your Reporting Kit instance, which you will be able to see in the dashboards.
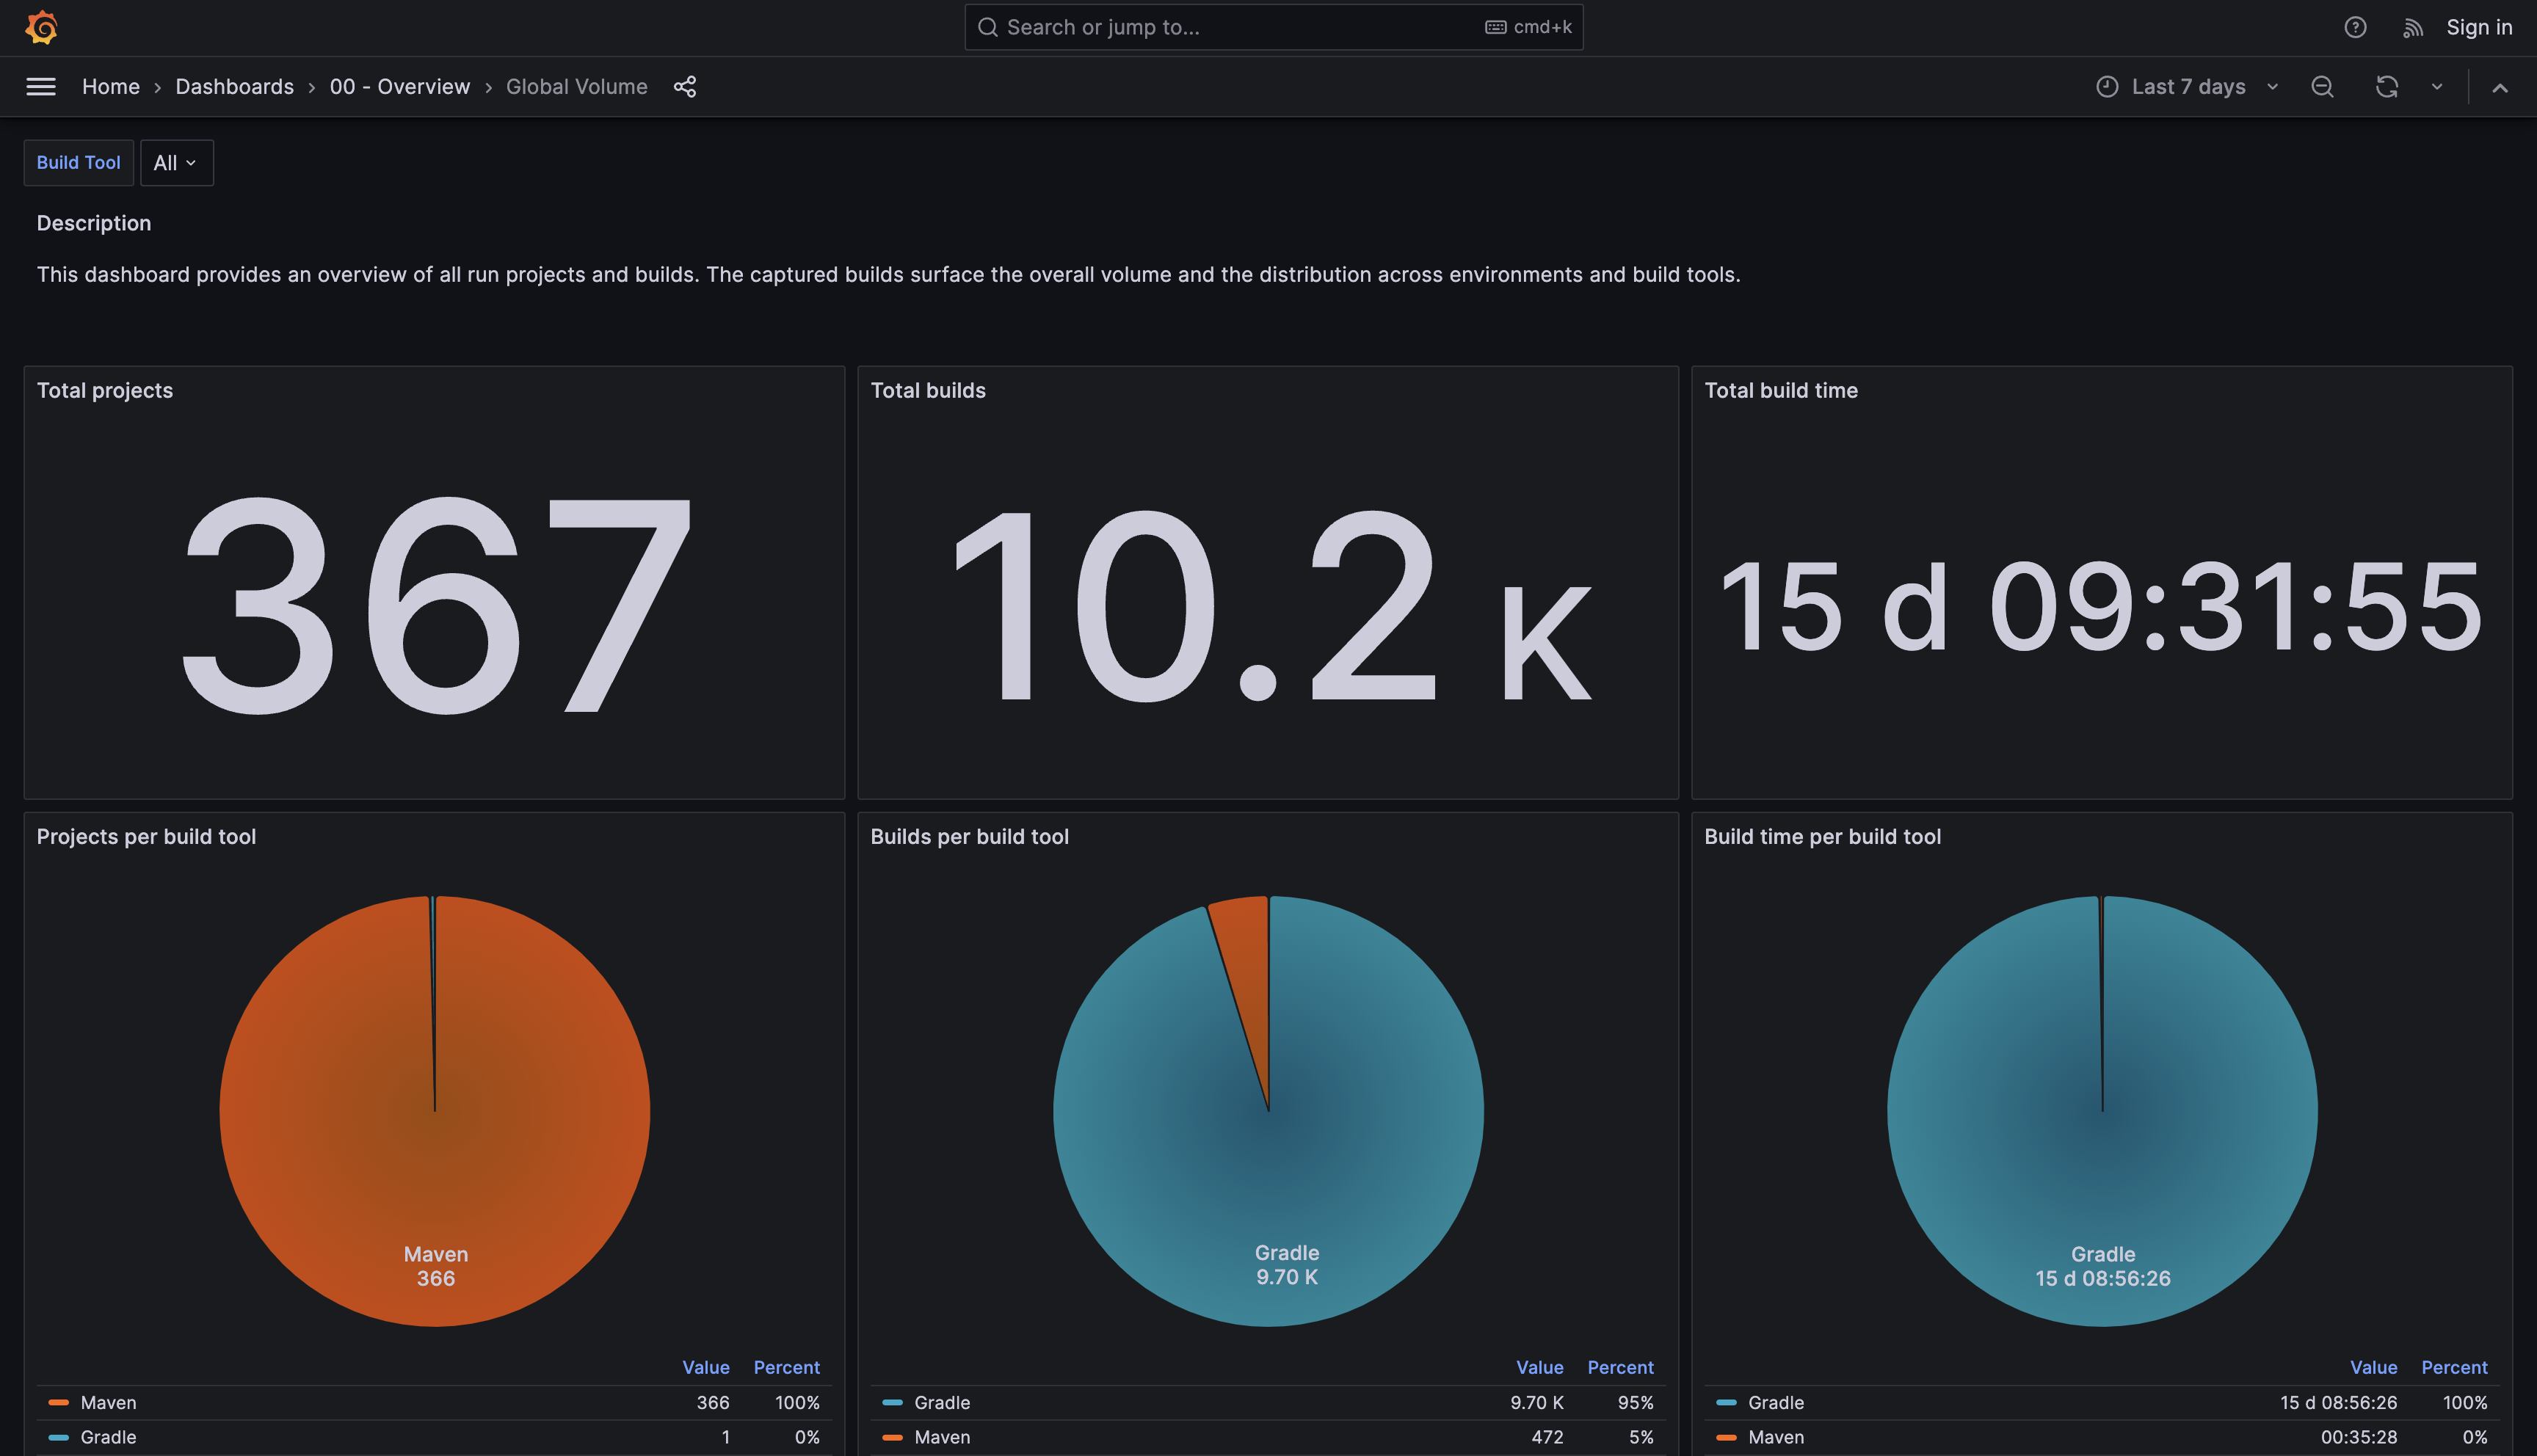
General Overview Dashboard
At this point, the Develocity Reporting Kit instance is installed and running.
Check the [troubleshooting](#faq_dashboards) section if your dashboard doesn’t display data within 15 minutes.
## Airgap Installation
In an airgap installation, the container images can either be pulled from an image registry available on an internal network that’s accessible from the cluster, or, if you are installing the Reporting Kit on K3s, they can be loaded directly into the Kubernetes node, meaning that they don’t need to be pulled from a registry.
Airgap installations require a specific entitlement on your license. Please contact Gradle if you need an Airgap-enabled license.
Airgap installation involves downloading files, transferring them, installing supporting software, and running `helm install`.
We recommend you save all the files into a single **transfer directory**, so that it’s easy to transfer to the host where you are installing the Develocity Reporting Kit. For example:
```shell
mkdir develocity-reporting-kit-files && cd develocity-reporting-kit-files
```
### 1. Download the Required Files
#### a. Download K3s (If applicable)
If installing onto a standalone host using K3s, you need to also install K3s on your airgapped installation host. Otherwise, this step can be skipped.
Please make note of the checksums provided in the [k3s release page](https://github.com/k3s-io/k3s/releases). The checksums can be found under `Assets/sha256sum-amd64.txt` for the release that you are planning to use.
To get the name of the release, please execute the following command:
```shell
curl -s https://api.github.com/repos/k3s-io/k3s/releases/latest | jq -r '.tag_name'
```
Then you can download and verify the K3s images, binary, and install script:
```shell
curl -LO https://github.com/k3s-io/k3s/releases/latest/download/k3s
```
```shell
curl -LO https://github.com/k3s-io/k3s/releases/latest/download/k3s-airgap-images-amd64.tar.gz
```
```shell
curl -L -o install_k3s.sh https://get.k3s.io
```
```shell
echo " k3s" | sha256sum -c -
```
```shell
echo " k3s-airgap-images-amd64.tar.gz" | sha256sum -c -
```
If you are running Red Hat Enterprise Linux with SELinux enabled, you will also need to download and verify the K3s SELinux Policy package:
```shell
curl -L -o k3s-selinux.el8.noarch.rpm https://github.com/k3s-io/k3s-selinux/releases/download/v1.2.stable.2/k3s-selinux-1.2-2.el8.noarch.rpm
```
```shell
echo "e949fde3e0255c6b5ce3f52db4277897882ed1664e87bfcf5122df5e96559340 k3s-selinux.el8.noarch.rpm" | sha256sum -c -
```
#### b. Download Helm
Download and verify the Helm binary:
```shell
curl -L -o helm-linux-amd64.tar.gz https://get.helm.sh/helm-v3.15.4-linux-amd64.tar.gz
```
```shell
echo "bbb6e7c6201458b235f335280f35493950dcd856825ddcfd1d3b40ae757d5c7d helm-linux-amd64.tar.gz" | sha256sum -c -
```
#### c. Download the Installation Bundle
Save your Develocity license to the [transfer directory](#transfer-directory) as `develocity.license`.
Download and verify the airgap bundle:
```shell
curl -LOJd @develocity.license https://registry.gradle.com/airgap/develocity-reporting-kit-2.2.1-bundle.tar.gz
```
```shell
curl -LOJd @develocity.license https://registry.gradle.com/airgap/develocity-reporting-kit-2.2.1-bundle.tar.gz.sha256
```
```shell
sha256sum -c develocity-reporting-kit-2.2.1-bundle.tar.gz.sha256
```
If checksum verification fails, check the contents of the downloaded files for error messages. If the error message indicates that your license is invalid/expired/not airgap enabled, you will need to request an updated license file by contacting your customer success representative.
> [!TIP]
> Instead of running the above `curl` commands, you can download the airgap bundle by navigating to [https://registry.gradle.com/airgap/develocity-reporting-kit](https://registry.gradle.com/airgap/develocity-reporting-kit) in your browser and following the instructions on the page.
### 2. Prepare a Helm Values File
Follow the instructions at [Helm Configuration](#helm_configuration) and return to this point with a complete `values.yaml` file.
If you are installing onto a standalone host using K3s, ensure your `values.yaml` file includes [appropriate configuration for the image pull policy](#airgap_installation_image_pull_policy).
Before transferring files to the host where you will install the Develocity Reporting Kit, move your Helm values file into the [transfer directory](#transfer-directory).
### 3. Transfer Files
Check that the transfer directory contains all of the following files (additional files are fine):
* `helm-linux-amd64.tar.gz`
* `develocity.license`
* `values.yaml`
* `develocity-reporting-kit-2.2.1-bundle.tar.gz`
* Optional: SSL certificates
If you are installing on a standalone host, check that the following files are also there:
* `k3s-airgap-images-amd64.tar.gz`
* `k3s`
* `install_k3s.sh`
* `k3s-selinux.el8.noarch.rpm` (only if your installation host is using SELinux)
Once you’ve verified that you have the required files, transfer them to the host where you are installing the Reporting Kit.
### 4. Install K3s (If applicable)
Only do this step if you are installing the Develocity Reporting Kit onto a standalone host using K3s.
Follow these instructions on the host where you are installing the Reporting Kit with your transferred files present in the current directory.
1. If you are running Red Hat Enterprise Linux with SELinux enabled:
1. Install the `container-selinux` package. This is a package that can be found in Red Hat Enterprise Linux’s default repository. Install this package on the airgapped server just like you would install any other package. If your organization has an internal mirror of the Red Hat package repositories, you can run:
```shell
sudo yum install -y container-selinux
```
2. Install the K3s SELinux Policy package:
```shell
sudo yum install -y k3s-selinux.el8.noarch.rpm
```
2. Install K3s and make it available to the current user:
```shell
sudo mkdir -p /var/lib/rancher/k3s/agent/images/
```
```shell
sudo cp k3s-airgap-images-amd64.tar.gz /var/lib/rancher/k3s/agent/images/
```
```shell
(cd /var/lib/rancher/k3s/agent/images/ && sudo gunzip -f k3s-airgap-images-amd64.tar.gz)
```
```shell
sudo cp k3s /usr/local/bin
```
```shell
sudo chmod a+rx /usr/local/bin/k3s
```
```shell
sudo chmod a+rx ./install_k3s.sh
```
```shell
INSTALL_K3S_SKIP_DOWNLOAD=true ./install_k3s.sh
```
```shell
sudo chown $UID /etc/rancher/k3s/k3s.yaml
```
```shell
mkdir -p "${HOME}/.kube"
```
```shell
ln -sf /etc/rancher/k3s/k3s.yaml "${HOME}/.kube/config"
```
3. Verify that you can interact with the K3s cluster:
```shell
kubectl get namespace
```
The output should be similar to this:
**Output:**
```
NAME STATUS AGE
default Active 1h
kube-system Active 1h
kube-public Active 1h
kube-node-lease Active 1h
```
### 5. Install Helm
Follow these instructions on the host where you are installing the Reporting Kit with your transferred files present in the current directory.
To install Helm:
```shell
tar -zxvf helm-linux-amd64.tar.gz
```
```shell
sudo mv linux-amd64/helm /usr/local/bin/helm
```
### 6. Install the Develocity Reporting Kit
Follow these instructions on the host where you are installing the Reporting Kit with your transferred files present in the current directory.
Expand the bundle:
```shell
tar zxvf develocity-reporting-kit-2.2.1-bundle.tar.gz
```
#### Import Develocity Reporting Kit images
If you are installing the Reporting Kit onto a standalone host with K3s, import the images into K3s using the following command:
```shell
sudo k3s ctr images import develocity-reporting-kit-2.2.1-images.tar
```
Otherwise, upload the images to your internal image registry:
> [!NOTE]
> You must be logged in to the registry before running these commands.
```shell
./upload-images.sh --registry=registry.example.com/develocity-reporting-kit
```
#### Install the Develocity Reporting Kit Helm chart in airgap mode
Install the Develocity Reporting Kit using Helm:
```shell
helm install \
--create-namespace --namespace develocity-reporting-kit \(1)
develocity-reporting-kit \(2)
develocity-reporting-kit-2.2.1.tgz \
--values values.yaml \(3)
--set-file global.license.file=./develocity.license(4)
```
1. This example uses develocity-reporting-kit as the namespace, but it can be a custom name. If you use a custom name, update all other example commands accordingly.
2. This is the Helm release name. It’s used by Helm to identify the Reporting Kit installation.
3. The Helm values file with configuration values, including items such as the Develocity address.
4. The Develocity license file (if not already included in the values file).
### 7. Confirm That the Develocity Reporting Kit Is Running
At this point, it should be possible to see the Helm release installed:
```shell
helm --namespace develocity-reporting-kit list
```
**Output:**
```
NAME NAMESPACE REVISION UPDATED STATUS CHART APP VERSION
develocity-reporting-kit develocity-reporting-kit 1 2024-04-05 16:20:07.618596 +0800 +08 deployed develocity-reporting-kit-2.2.1 2.2.1
```
You can inspect the status of the Develocity Pods:
```shell
kubectl --namespace develocity-reporting-kit get pods
```
**Output:**
```
NAME READY STATUS RESTARTS AGE
grafana-5bd84f6bff-jhl8v 0/2 ContainerCreating 0 12s
trino-worker-79f8ddfdd8-k6fc6 0/1 Init:0/1 0 12s
trino-coordinator-7d8794689-jrqn6 0/1 Init:0/1 0 12s
data-synchronizer-8489cd7749-gxv8h 0/1 Init:0/2 0 12s
minio-7b9d87c4c7-tsqss 0/1 ContainerCreating 0 12s
hive-metastore-7bfc5977b8-vwzkf 0/2 ContainerCreating 0 12s
```
> [!NOTE]
> Sometimes containers will initially fail when they start up because other Pods they depend on aren’t ready yet. This is normal and expected. In Kubernetes applications, it’s idiomatic for containers to repeatedly attempt to start, crash, and be restarted by the Kubelet until their dependencies are ready, because this prevents wasted allocation of requested resources while dependencies are starting up.
Within several minutes all the Pods should have the status `Running`:
**Output:**
```
NAME READY STATUS RESTARTS AGE
minio-7b9d87c4c7-tsqss 1/1 Running 0 8m10s
grafana-5bd84f6bff-jhl8v 2/2 Running 0 8m10s
hive-metastore-7bfc5977b8-vwzkf 2/2 Running 2 (6m23s ago) 8m10s
trino-worker-79f8ddfdd8-k6fc6 1/1 Running 0 8m10s
trino-coordinator-7d8794689-jrqn6 1/1 Running 0 8m10s
data-synchronizer-8489cd7749-gxv8h 1/1 Running 0 8m10s
```
The Develocity Reporting Kit has a `/ping` endpoint, which you use to verify that the application is accessible from your computer.
Connectivity to the Develocity Reporting Kit installation can be tested by running the following command on machines which need to connect to it:
```shell
curl -sw \\n --fail-with-body --show-error «develocity-reporting-kit-origin»/ping
```
This should show the text `SUCCESS`.
Once all Pods have a status of `Running` and the system is up and connected, you can interact with the Develocity Reporting Kit instance by visiting its address in a web browser. The root path of the Reporting Kit application is currently a generic Grafana landing page. If you navigate to the `/dashboards` path, you should be able to see a list of dashboard folders containing different dashboards for you to explore.

Dashboards Listing Page
Within 10 minutes of the instance being up and running, data from your Develocity instance should have started to get synced to your Reporting Kit instance, which you will be able to see in the dashboards.

General Overview Dashboard
At this point, the Develocity Reporting Kit instance is installed and running.
Check the [troubleshooting](#faq_dashboards) section if your dashboard doesn’t display data within 15 minutes.
## Post-Installation
Once the Develocity Reporting Kit has been installed, files used during installation aren’t required at runtime and can be removed if desired. However, the following files may be useful to preserve, as they may aid in future upgrades or maintenance:
* Helm values files
* SSL certificates
* Develocity license
> [!WARNING]
> These files contain sensitive information and should be handled with care.
## Upgrading
Before upgrading, check the [release notes](https://docs.gradle.com/develocity/reporting-kit/2.2/release-history/) for any special considerations when upgrading from older versions of the Develocity Reporting Kit.
Any new or updated Helm config values you specify will be merged with previous Helm config values when you run the [helm upgrade](#execute_helm_upgrade) command.
To force `helm upgrade` to use only the values that you set at upgrade time, run with `--reset-values` instead of `--reuse-values`.
> [!WARNING]
> Running `helm upgrade` with `--reset-values` will cause any previous values to be lost. All values (including license files, SSL certificates, etc.) will need to be set as part of the command.
If using `helm template`, all values must be supplied for each invocation, including any files, as if you had used `--reset-values`.
### Online
#### 1. Upgrade Helm
Identify the latest Helm versions supported by the version of Develocity Reporting Kit you are upgrading to using the [compatibility matrix](https://docs.gradle.com/develocity/2026.1/miscellaneous/compatibility/).
Then upgrade Helm:
```shell
curl -fsSL -o get_helm.sh https://raw.githubusercontent.com/helm/helm/main/scripts/get-helm-3
```
```shell
chmod 700 get_helm.sh
```
```shell
./get_helm.sh -v «helm-version»
```
#### 2. Upgrade the Develocity Reporting Kit
To upgrade Develocity Reporting Kit:
1. To update locally available charts, run:
```shell
helm repo update gradle
```
2. Run the upgrade command:
```shell
helm upgrade \
--namespace develocity-reporting-kit \
--reuse-values \(1)
develocity-reporting-kit gradle/develocity-reporting-kit (2)
```
1. The --reuse-values parameter instructs Helm to reuse previous values.
2. Use the Helm release name you used during installation (develocity-reporting-kit in the examples in this guide).
### Airgap
Upgrading an airgap instance of Develocity Reporting Kit requires downloading the updates, transferring them to a machine with access to the Kubernetes cluster and container registry, and then installing them.
You can follow the steps outlined in the [Airgap Installation](#airgap) to run the required preparation steps.
#### Upgrade the Develocity Reporting Kit
Then upgrade Develocity Reporting Kit:
```shell
tar zxvf develocity-reporting-kit-«chart-version»-bundle.tar.gz (1)
```
1. Unpacks the airgap bundle. You may have already done this, in which case you can skip this command.
```shell
helm upgrade \
--namespace develocity-reporting-kit \
--reuse-values \(1)
develocity-reporting-kit develocity-reporting-kit-«chart-version».tgz (2)
```
1. The --reuse-values parameter instructs Helm to reuse previous values.
2. Use the Helm release name you used during installation (develocity-reporting-kit in the examples in this guide).
### Changing Configuration Values
To change configuration values, follow the same procedure as for [upgrading](#upgrading), but specify the current version to ensure that you don’t accidentally install a later version.
> [!IMPORTANT]
> It’s important to specify the currently installed version, because if you don’t, you may accidentally install a newer version and initiate an upgrade rather than merely a configuration change. Such accidental upgrades may be irreversible.
To check the currently deployed version, run:
```shell
helm history --namespace develocity-reporting-kit develocity-reporting-kit --max 1
```
To apply new configuration values to a Helm-managed online installation, run:
```shell
helm upgrade \
--namespace develocity-reporting-kit \
develocity-reporting-kit gradle/develocity-reporting-kit \
--version «deployed-version» \
--reuse-values \
«new values options»
```
or for a Helm-managed airgap installation:
```shell
helm upgrade \
--namespace develocity-reporting-kit \
develocity-reporting-kit develocity-reporting-kit-«deployed-version».tgz \
--version «deployed-version» \
--reuse-values \
«new values options»
```
> [!NOTE]
> Since you are using the same version of Develocity Reporting Kit, you should already have the `develocity-reporting-kit-«deployed-version».tgz` Helm chart file on the host. If not, you can obtain it by following [this step](https://docs.gradle.com/develocity/2026.1/installation/kubernetes-installation/#airgap_bundle_download) of the installation guide.
> [!WARNING]
> Ensure the chart file’s version matches the version of the installed Develocity Reporting Kit instance. If you use a different version, Develocity Reporting Kit’s images may not be present on the host, and Develocity Reporting Kit won’t start. To use a later version of Develocity Reporting Kit, follow the upgrade instructions earlier in this guide.
Where `«deployed-version»` is the running version of Develocity Reporting Kit. The above examples reuse previous values by default. Any specified values will override the existing values. Alternatively, if you want to specify all values explicitly (ignoring any previously set values), run with `--reset-values` instead of `--reuse-values`.
> [!WARNING]
> Running `helm upgrade` with `--reset-values` will cause any previous values to be lost. All values (including license files, SSL certificates, etc.) will need to be set as part of the command.
Configuration values are provided to Helm when running the `helm` command by:
* Providing a Helm values file (which can contain inline files) with `--values`
* Providing files (such as the Develocity license or certificates) with `--set-file`
If you have made local modifications to a Helm values file, apply the changes to your installation by running an upgrade command (see above) with a `--values «updated-values-file»` option.
If you have made local modifications to a file you previously provided via `--set-file`, apply the changes to running an upgrade command (see above) with a `--set-file` option.
## Upgrading From 1.x to 2.x
> [!IMPORTANT]
> Performing this major version upgrade without understanding this upgrade guide may lead to unexpected data loss or unexpected changes in data availability in the Reporting Kit. If in doubt, contact the Develocity support team or your customer success representative.
Develocity Reporting Kit 2.0 introduces an improved algorithm for synchronizing data between Develocity and the Reporting Kit, which provides better assurances about the accuracy and recency of the data shown in the dashboards.
Other new features include new dashboards, improvements to existing dashboards and the ability to query the Reporting Kit’s Trino query engine directly using your own tools.
This section contains instructions on how to upgrade an existing Reporting Kit installation of version 1.2 or later to the latest 2.x version.
> [!IMPORTANT]
> If you are upgrading from a Develocity Reporting Kit of version 1.1 or older, please upgrade to version 1.4 first, and then subsequently upgrade to 2.x. Upgrading from version 1.1 or older directly to 2.x will fail with an error in Grafana.
### Develocity Compatibility
The Reporting Kit 2.0 should only be used with Develocity instances running version 2025.3 or later.
It’s nevertheless possible to run the Reporting Kit 2.0 alongside earlier versions of Develocity. This is described in the later section, [Maintaining data availability throughout the upgrade](#upgrade_guide_2_0_maintaining_data_availability).
### Required Resynchronization of Data
The Develocity Reporting Kit 2.0 improves the accuracy and recency of the data shown in the dashboards, compared with earlier versions. In order to do this, it stores data in a different way, which is unfortunately not compatible with stored data from the 1.x versions of the Reporting Kit. This new synchronization algorithm also requires your Develocity instance to be at least 2025.3.
This means that as part of updating to a 2.x version, your Reporting Kit instance will abandon its existing data and start resynchronizing all builds from Develocity from scratch. If you want to retain the ability to query your existing data in the meantime, [the next section](#upgrade_guide_2_0_maintaining_data_availability) describes how you can achieve this.
There are two synchronization processes which run in parallel in the Reporting Kit to repopulate it with your build model data from Develocity. Firstly, a process which is constantly synchronizing recent builds uploaded to Develocity, and secondly, a process which scans backwards from the present moment until the edge of Develocity’s configured retention window, and ensures that the set of past builds stored by the Reporting Kit matches the set of builds stored by Develocity.
The Reporting Kit downloads new build model data from Develocity continuously, however it’s only compacted and made visible to the Grafana dashboards when all the builds which started within a given hour have been downloaded. For this reason, after startup it may take 30 minutes or in some cases slightly longer for the most recent data to appear in the dashboards. The delay between builds being uploaded to Develocity and them becoming visible in the Reporting Kit depends on the rate of build traffic to your Develocity instance: If there are more builds in a given hour, then it will take longer for the Reporting Kit to download and synchronize all of them. If you have concerns about data not appearing in your dashboards, have a look at [our troubleshooting guide](#faq_trouble_shooting), or contact the Develocity support team.
#### Maintaining Data Availability Throughout the Upgrade
To avoid any data downtime during the upgrade process, you can set up a secondary instance of the Reporting Kit running the latest 2.x version. If your existing Reporting Kit instance is running on a standalone host, you need to install the secondary instance on a different host. If your existing Reporting Kit instance is running in an existing Kubernetes cluster, you need to install the secondary instance in a different Kubernetes namespace.
Keep your primary, existing Develocity Reporting Kit 1.x instance as-is - you don’t need to upgrade it. Whilst your primary, existing instance is running and allowing you to continue to visualize data in its dashboards, your secondary Reporting Kit instance will be catching up, synchronizing data from Develocity using the 2.x synchronization algorithm and storing it in the correct format.
Once your secondary instance has synchronized data for all of your historical and recent builds, you can switch over to using the new instance for visualizing your data, and then safely decommission your primary instance.
### Changes to Data Retention
The retention period of all builds stored by Reporting Kit 2.0 now matches the Build Scan retention period configured in the Develocity instance from which it pulls data. Builds which fall out of the retention window in Develocity will automatically be deleted from the Reporting Kit too. This is in contrast to version 1.x, which kept builds indefinitely but didn’t keep them up to date with changes in Develocity or with the schema used by the dashboards.
For more information about retention, please see the [Develocity Administration Manual](https://docs.gradle.com/develocity/2026.1/administration/build-scan/build-scan-storage/#disk_space_management).
### Schema Changes
In case you are using custom queries or dashboards with the Reporting Kit, please note that this major version upgrade to 2.0 includes some breaking changes to the data schema, described in this section. No action is required if you are only using the built-in dashboards, as they’re compatible with the new schema.
The `build_start_time` column is now an internal partition column. This has no effect on most tables and views as it didn’t exist, except for the following:
* `gradle_task_summary`
* `maven_goal_summary`
* `unit_execution_summary`
Custom queries using `build_start_time` in these tables will need to be updated to use `build_start_timestamp` instead, which has the same data type and meaning as the previous definition.
## FAQ
This section provides answers to frequently asked questions and some guidance on troubleshooting your Develocity Reporting Kit installation.
### General Troubleshooting
If you experience issues with Develocity Reporting Kit or [related](https://gradle.com/develocity/resources/) components, please submit a support ticket at [support.gradle.com](https://support.gradle.com), including details of the issue and an attached support bundle.
Support bundles assist our engineers in troubleshooting your issue by providing the information about your Reporting Kit installation. All secrets and sensitive data are redacted and are therefore not captured. The recorded data in a support bundle is listed below:
* Container logs
* Various Kubernetes resource information
* Helm values used to install the Reporting Kit (all secrets redacted)
To create a support bundle, you need to use the [develocityctl](https://docs.gradle.com/develocity/develocityctl/1.22/) command line tool and run the `support-bundle` command.
Example of downloading a support bundle using the `develocityctl` JAR file:
```shell
java -jar develocityctl.jar \
--kube-ns=develocity-reporting-kit \
support-bundle \
--skip-operator (1)
```
1. This option is currently required for avoiding warnings during the process.
Example downloading a support bundle using the `develocityctl` Docker image:
```shell
docker run --rm -it \
-v "${HOME}/.kube/config:/kube-config:ro" \
-v "${HOME}/bundles:/home" \
gradle/develocityctl \
--kube-ns=develocity-reporting-kit \
support-bundle \
--skip-operator (1)
```
1. This option is currently required for avoiding warnings during the process.
`develocityctl` CLI responds to a successful command with the following and stores the generated support bundle in the directory from which the command is executed:
`Support bundle saved to /home/ubuntu/support-bundle-20240118-183259.zip`
### Installation
This section addresses common questions and issues related to the installation of the Develocity Reporting Kit.
#### Can I Use the Same Namespace for Develocity and the Reporting Kit?
🔍 **Answer**
Yes, installing the Reporting Kit into the same Kubernetes namespace as Develocity is possible. However, we advise against it if possible due to resource competition between the applications.
For more information, refer to [installing it into the same Kubernetes namespace as Develocity](#installing_into_the_same_kubernetes_namespace_as_develocity).
> [!NOTE]
> If you have any questions, contact the Develocity support team by creating a support ticket.
### Empty Dashboards
This section provides guidance for troubleshooting common issues with empty Grafana dashboards.
When the Reporting Kit is started for the first time, the data-synchronizer Pod begins pulling build data from the configured Develocity instance.
However, builds that have been pulled and saved to MinIO aren’t immediately visible to Grafana queries; it can take _several minutes_ for the data to appear in the dashboards.
By default, [Query Result Caching](#query_result_caching) is enabled. [Turning off the query cache](#disabling_the_query_result_cache) can help troubleshoot empty dashboards. You can re-enable it later for improved performance once the data is correctly displayed in the dashboards.
🔍 **Troubleshooting steps**
The most common reason for empty dashboards after installation is that none of the first downloaded Build Scan data have yet been compacted in MinIO for performant read operations in Grafana queries. The first time this compaction happens will correspond with when build data becomes visible in your Reporting Kit instance’s Grafana dashboards.
As a first step, validate that all Pods are up and running.
After deploying the Reporting Kit, it may take a short while until all Pods are running and ready.
##### Check the Status of the Pods
Use the below `kubectl` command to check if all Pods are up and running and ready.
```console
kubectl --namespace develocity-reporting-kit get pods
```
**Output:**
```
NAME READY STATUS RESTARTS AGE
minio-7b9d87c4c7-tsqss 1/1 Running 0 8m10s
grafana-5bd84f6bff-jhl8v 2/2 Running 0 8m10s
hive-metastore-7bfc5977b8-vwzkf 2/2 Running 0 8m10s
trino-worker-79f8ddfdd8-k6fc6 1/1 Running 0 8m10s
trino-coordinator-7d8794689-jrqn6 1/1 Running 0 8m10s
data-synchronizer-8489cd7749-gxv8h 1/1 Running 0 8m10s
```
If all Pods are running and ready, but your dashboards are empty, the data-synchronizer app may still be busy copying data to populate the first batch of Build Scan data, which will be compacted in MinIO for performant read operations. It can take _several minutes_ for the data to appear in the dashboards.
By default [Query Result Caching](#query_result_caching) is enabled. [Turning off the query cache](#disabling_the_query_result_cache) will make it easier for you to troubleshoot empty dashboards. You can re-enable it afterward for improved performance once you’re satisfied that the data is showing up in the dashboards.
* * *
##### Check the Logs for More Information
If your dashboards aren’t displaying data after some time, check the logs of the main container of the data-synchronizer Pod for more information.
For example, if connectivity issues exist between the data-synchronizer app and the configured Develocity instance, that problem will appear in the logs of this container.
Use the below `kubectl` command to get the list of all running Pods of the Develocity Reporting Kit and look for the data-synchronizer Pod.
```console
kubectl --namespace develocity-reporting-kit get pods
```
**Output:**
```
NAME READY STATUS RESTARTS AGE
minio-7b9d87c4c7-tsqss 1/1 Running 0 8m10s
grafana-5bd84f6bff-jhl8v 2/2 Running 0 8m10s
hive-metastore-7bfc5977b8-vwzkf 2/2 Running 0 8m10s
trino-worker-79f8ddfdd8-k6fc6 1/1 Running 0 8m10s
trino-coordinator-7d8794689-jrqn6 1/1 Running 0 8m10s
data-synchronizer-8489cd7749-gxv8h 1/1 Running 0 8m10s (1)
```
1. data-synchronizer-8489cd7749-gxv8h is the data-synchronizer Pod in this example.
In the next step use `kubectl logs` to gather more information about the Pod. This command will provide detailed information about the Pod, which will help troubleshoot.
See the official [kubectl logs](https://kubernetes.io/docs/reference/kubectl/generated/kubectl_logs/) documentation for more details.
```console
kubectl --namespace develocity-reporting-kit logs data-synchronizer-8489cd7749-gxv8h -c main
```
**Output:**
```
Defaulted container "main" out of: main, initializer (init), trino-schema-migrator (init)
2024-11-10 16:58:18,655 INFO c.g.d.r.d.DrkdsMain {} No app plugins loaded
2024-11-10 16:58:19,062 INFO r.s.RatpackServer {} Starting server...
2024-11-10 16:58:19,082 INFO r.s.RatpackServer {} Building registry...
2024-11-10 16:58:23,170 INFO r.s.RatpackServer {} Initializing 19 services...
2024-11-10 16:58:23,248 INFO c.g.d.q.Trino {eid=pwkw7olftx4d2} Validating Trino connection
2024-11-10 16:58:23,550 INFO c.g.d.q.Trino {eid=pwkw7olftx4d2} Connected to Trino version 450
2024-11-10 16:58:23,646 INFO c.g.d.r.Develocity {eid=6dlih6vbmbv66, peid=krc5dvy7poofy} Attempting to connect to Develocity https://develocity.example.com with key starting with rw7…
2024-11-10 16:58:23,745 INFO r.s.RatpackServer {} Ratpack started for http://localhost:8080
```
> [!NOTE]
> If you see stack traces in the logs and worry that something might be wrong, contact the Develocity support team by creating a support ticket.
* If you encounter any errors about authentication and permissions, ensure that you followed the [Develocity configuration](#develocity_configuration) section and configured a Develocity access key and API permissions.
* If you see any errors related to TLS/SSL, check the documentation about [Trusted TLS Certificates](#trusted_tls_certificates) and [TLS](#ingress_ssl).
### Discrepancy in Data Between the Reporting Kit and Develocity
In certain situations, you may find that the Reporting Kit shows different numbers than the Develocity UI. Most notably, the _Build count_ metric on the _Global Volume_ dashboard might not match the number of builds shown in Develocity’s scan list page for the same time range.
A few factors can cause this discrepancy:
* Build synchronization from Develocity to the Reporting Kit isn’t instantaneous. It takes some time for the Reporting Kit to work backward to download all historical builds. At the same time, the Reporting Kit will also continuously work its way forward to download the most recent new builds. This process doesn’t happen in real-time, so the data in the Reporting Kit will always lag behind the data in Develocity for up to a few minutes.
* The build data is periodically queued for synchronization. Recent builds may take up to 10 minutes to be queued. The time for the build to appear after that depends on the level of build traffic the Develocity instance experiences. Depending on build traffic, it can take up to 30 minutes for the most recent data to appear in the dashboards. If it takes longer than that, then there may be a problem, so contact Gradle support.
* The queries in the dashboards discard the 'time' part of the dates selected in the date picker and work only on the dates. In addition, the dates are converted to UTC before being sent to the query engine. If a non-UTC timezone is used when selecting the dates in Grafana, this can spill over into the previous or next day, and query results unexpectedly contain a full extra day of data.
* Some builds are globally filtered out in all dashboards. Most notably, we filter builds that failed very early in the build process and thus didn’t produce much useful data.
* The values displayed on the dashboard might have come from the query cache. By default, the Reporting Kit caches the result of every dashboard query for 24 hours, so if the dashboard you are looking at has been previously viewed in the same time range, it might not include the most recent builds.
🔍 **Troubleshooting steps**
##### Check the Timezones
When you compare build numbers in Develocity and the Reporting Kit’s Grafana dashboards, please ensure the selected time zones are the same. While Develocity defaults to use the browser’s timezone, the Reporting Kit uses the UTC timezone. A general recommendation is always to view dashboards with the UTC timezone to avoid spilling the selected time range over to the previous/next day. Likewise, when comparing build count numbers of the Reporting Kit with Develocity, ensure that you also select UTC in Develocity.
##### Run a Custom Query to Verify Build Count Numbers
To check whether some builds are filtered out from dashboards, you can check the build count in the unfiltered `build` table via a custom query. To run a custom query, log in to Grafana via the editor account. Once logged in, navigate to the _Explore_ view and run a query like e.g.:
```sql
-- trino.cache.retention=0
SELECT COUNT(*) "Build count" FROM build
```
or
```sql
-- trino.cache.retention=0
SELECT type "Build tool", COUNT(*) "Build count" FROM build GROUP BY type
```
##### Select a Different Date Range That Hasn’t Yet Been Cached
If you suspect that query results on a dashboard might have come from the cache, you can try to select a different date range in Grafana. The selected date range is part of the cache key, so selecting a range that has likely not been viewed before will force Grafana to run the query again. It’s also possible to disable the cache entirely by setting the `trino.cache.defaultRetention` Helm value to `0`. More details in [Query Result Caching](#query_result_caching).
##### Check the Logs for Synchronization Issues
Check the data-synchronizer Pod logs for synchronization insights. The app regularly logs health check information, which can help you understand if the synchronization is running as expected.
###### Default Behavior
**Output:**
```
Healthy:
Healthy:
[...] (1)
- KitSyncQueue: {queuedMissingWork=0, queuedExistingWork=5} (2)
- KitSyncQueueOperations: {oldestEntry=2025-03-07T15:00:00Z, newestEntry=2025-09-16T06:00:00Z, operationDetails=enqueue-drop:[new:0,existing:0],enqueue-full_export:[new:4435,existing:0],enqueue-update:[new:0,existing:591],completion-drop:[new:0,existing:0],completion-full_export:[new:1104,existing:0],completion-update:[new:0,existing:585],cancellation-drop:[new:0,existing:0],cancellation-full_export:[new:0,existing:0],cancellation-update:[new:0,existing:40],claim-drop:[new:0,existing:0],claim-full_export:[new:1105,existing:0],claim-update:[new:0,existing:626], operationRates=enqueue:[1m:0.01,5m:0.00,15m:0.00],completion:[1m:0.00,5m:0.00,15m:0.00],cancellation:[1m:0.00,5m:0.00,15m:0.00],claim:[1m:0.00,5m:0.00,15m:0.00]} (3)
```
1. Some health check entries omitted for brevity
2. Shows the number of units of work that are queued for synchronization. queuedMissingWork refers to units of work that aren’t yet synchronized. A non-zero amount indicates that there may be new builds that will be added when the synchronization is done. queuedExistingWork refers to units of work that have been previously synchronized but may need to be updated due to changes in Develocity.
3. A detailed breakdown of operations that have been performed. oldestEntry and newestEntry show the time range of the queued work. operationDetails shows the total number of operations that have been performed since restart, split by operation type and whether they were for new or existing units of work. operationRates shows the rate at which operations are being performed over different time windows. Depending on the level of build traffic your Develocity instance experiences, you may see these rates being zero, in which case you can look at the total counts in operationDetails to see if any operations have been performed at all
Characteristics of a healthy newly set up instance:
* should have a high `queuedMissingWork` (in the thousands) - indicating that the Reporting Kit has detected possible missing builds in its units of work. This should grow over time as the Reporting Kit works its way backward through historical builds, and then trend to zero as it catches up
* should have a low or zeroed-out `queuedExistingWork` - there should be little to no updates to builds which have just been synchronized
* should have a `newestEntry` relatively close to the most recent build in Develocity
* should have a constantly increasing number of operations performed in `operationDetails`, indicating that the synchronization is making progress. Note that the counts will reset to zero if the pod is restarted, this is expected behavior
Characteristics of a healthy long-running instance:
* should have a very low or zeroed `queuedMissingWork` - indicating that there are no new builds left to discover. Once the Reporting Kit has caught up with all historical Develocity builds,`queuedMissingWork` shouldn’t exceed single digits, or it will indicate that more builds are being created in Develocity than the Reporting Kit can keep up with
* should have a low or 0 `queuedExistingWork` - indicating that all existing builds are up to date
* should have an `oldestEntry` matching the retention period of Develocity, which combined with a low `queuedMissingWork` indicates that all builds within the retention period have been discovered
* should have a `newestEntry` relatively close to the most recent build in Develocity
* should have a constantly increasing number of operations performed in `operationDetails`, indicating that the synchronization is making progress. The rate of change may be low, as the number of required operations should be low if the instance has caught up to the most recent builds in Develocity. Note that the counts will reset to zero if the pod is restarted, this is expected behavior.
* * *
If you have any questions or need any assistance please contact the Develocity support team or your customer success representative.
## Appendix
### Appendix A: Deterministic Helm Output
By default, the Helm chart generates several random secrets. Some Helm chart deployment tools, such as ArgoCD, will re-run Helm to compare the rendered Kubernetes manifests with the resources that are installed in the cluster, and reinstall the Helm chart if they’re different. For this to work correctly, the output of `helm template` must be _deterministic_. It’s possible to get deterministic output from the Develocity Reporting Kit Helm chart by fixing all the secret values used by the chart, so that they aren’t regenerated during template rendering. The secret values which are randomly generated by default can be fixed in two ways, either you can provide the secret inline in your values file, or you can create a user-managed Kubernetes secret in the same namespace in which you’re installing the Reporting Kit, and include the name of the secret in your values file.
#### Using Inline Configuration
Here is an example Helm config showing the values you need to use in order to provide all required secret values inline in your values file.
**values.yaml:**
```
global:
license:
file: "..."
develocity:
address: "..."
accessKey: "..."
ingress:
hostname: "..."
ssl:
enabled: true
cert: "..."
key: "..."
grafana:
securityKey:
value: "..."
adminAccount:
password: "..."
minio:
rootAccount:
password: "..."
dataSynchronizerAccount:
password: "..."
trinoAccount:
password: "..."
trinoCacheAccount:
password: "..."
trino:
internalCommunicationSecret:
value: "..."
systemAccount:
credentials:
basic:
user: trino-system
password: "..."
userAccount:
credentials:
basic:
user: trino-user
password: "..."
cache:
ssl:
cert: "..."
key: "..."
coordinator:
ssl:
cert: "..."
key: "..."
```
#### Using User-Managed Secrets
To provide required secret values using [user-managed secrets](#user-managed-secrets), you can create the following Kubernetes secrets in the Reporting Kit’s installation namespace and pass the secret name into the corresponding Helm value, as described below.
* `develocity.accessKey.secretName`, secret must have a single `accessKey` property.
* `ingress.ssl.secretName`, secret must be of the type `kubernetes.io/tls`. See [the Kubernetes documentation](https://kubernetes.io/docs/concepts/configuration/secret/#tls-secrets) for further information. This secret is only necessary if ingress SSL is enabled.
* `trino.cache.ssl.secretName`, secret must be of the type `kubernetes.io/tls`. See [the Kubernetes documentation](https://kubernetes.io/docs/concepts/configuration/secret/#tls-secrets) for further information. This secret isn’t necessary if [internal HTTPS is disabled](#disabling_internal_https).
* `trino.coordinator.ssl.java.secretName`, secret is an [opaque secret](https://kubernetes.io/docs/concepts/configuration/secret/#opaque-secrets) which contains two data items: `truststore.pem` and `keystore.pem`. This secret can be constructed from a valid Kubernetes secret of type [kubernetes.io/tls](https://kubernetes.io/docs/concepts/configuration/secret/#tls-secrets). Set `truststore.pem` to the `tls.crt` key of the `kubernetes.io/tls` secret, and set `keystore.pem` to the concatenation of the `tls.crt` and `tls.key` keys of the `kubernetes.io/tls` secret, separated by a newline, and remember to base64 encode the resulting concatenated string to produce a valid Kubernetes Secret data item. This secret isn’t necessary if [internal HTTPS is disabled](#disabling_internal_https).
* `grafana.securityKey.secretName`, secret must have a single `key` property.
* `grafana.adminAccount.secretName`, secret must have a single `password` property.
* `minio.rootAccount.secretName`, secret must have a single `password` property.
* `minio.dataSynchronizerAccount.secretName`, secret must have a single `password` property.
* `minio.trinoAccount.secretName`, secret must have a single `password` property.
* `minio.trinoCacheAccount.secretName`, secret must have a single `password` property.
* `trino.internalCommunicationSecret.secretName`, secret must have a single `password` property.
* `trino.systemAccount.credentials.basic.secretName`, secret must have `user` and `password` properties.
* `trino.userAccount.credentials.basic.secretName`, secret must have `user` and `password` properties.
Here is an example Helm config showing the values you need to use in order to provide all required secret values using [user-managed secrets](#user-managed-secrets) in your values file.
**values.yaml:**
```
global:
license:
file: "..."
develocity:
address: "..."
accessKey:
secretName: example-develocity-access-key-secret
ingress:
hostname: "..."
ssl:
enabled: true
secretName: ingress-ssl-secret
grafana:
securityKey:
secretName: grafana-security-key-secret
adminAccount:
secretName: grafana-admin-account-secret
minio:
rootAccount:
secretName: minio-root-account-secret
dataSynchronizerAccount:
secretName: minio-syncApp-account-secret
trinoAccount:
secretName: minio-trino-account-secret
trinoCacheAccount:
secretName: minio-trinoCache-account-secret
trino:
internalCommunicationSecret:
secretName: trino-internal-secret
systemAccount:
credentials:
basic:
secretName: trino-system-credentials-secret
userAccount:
credentials:
basic:
secretName: trino-user-credentials-secret
cache:
ssl:
secretName: trino-cache-ssl-secret
coordinator:
ssl:
java:
secretName: trino-coordinator-jks-ssl-secret
```
### Appendix B: Installing Into the Same Kubernetes Cluster as Develocity
It’s possible to install the Reporting Kit into the same Kubernetes cluster as Develocity.
If Develocity is installed using the standalone Helm chart into a K3s cluster on a single host, please [see below for resource considerations](#standalone_develocity_resources).
#### Installing Into the Same Kubernetes Namespace as Develocity
When configuring the Develocity Reporting Kit to pull data from a Develocity instance that runs in the same namespace as the Develocity Reporting Kit, set the [`develocity.address`](#develocity_configuration) Helm value to the Develocity installation’s `gradle-proxy` Kubernetes service address. The URL should be `[http://gradle-proxy:80](http://gradle-proxy:80)`.
**values.yaml:**
```
develocity:
address: "http://gradle-proxy:80"
accessKey: "..."
```
#### Installing Into a Different Kubernetes Namespace as Develocity
When configuring the Develocity Reporting Kit to pull data from a Develocity instance that runs in a different namespace of the same cluster as the Develocity Reporting Kit, set the [`develocity.address`](#develocity_configuration) Helm value to a cluster-local address based on the Develocity namespace. The URL should be `http://gradle-proxy.«develocity-namespace».svc.cluster.local`.
For a Develocity instance installed in the `develocity` namespace, this would look like:
**values.yaml:**
```
develocity:
address: "http://gradle-proxy.develocity.svc.cluster.local"
accessKey: "..."
```
#### Standalone Develocity Resources
We don’t recommend installing the Reporting Kit into the same standalone instance as Develocity. If there are no other options though, it can be done with some additional resource limits put in place for the Reporting Kit.
Please consider the [Reporting Kit resource requirements](#resource_requirements) and [Develocity’s standalone resource requirements](https://docs.gradle.com/develocity/2026.1/installation/standalone-installation/#cpu_memory). At time of writing the most significant were 64 GiB of memory for the Reporting Kit, and 24 GiB of memory for Develocity. If your Develocity instance has been tuned to use more memory, please use that in subsequent calculations.
If your instance has enough memory for both applications, proceed without further configuration. It’s possible to install both Develocity and the Reporting Kit into a single host with for example, only 64 GiB of memory by tuning down the Reporting Kit’s memory consumption. To do so, make the following adjustment:
**values.yaml:**
```
trino:
worker:
resources:
requests:
memory: 24Gi
limits:
memory: 32Gi
```
If your host has less memory, you will need to adjust these values lower.
Note that when running the Reporting Kit with constrained memory, it’s possible that some data sets won’t be able to populate the dashboards. If you see errors in the dashboards relating to memory, try requesting a shorter window for example, just 2 days instead of the default or 7 days. This will require less memory to process.
### Appendix C: Storing Data in a Custom Directory for Standalone K3s
For users intending to install the Reporting Kit onto a single node using K3s, you may want to specify a particular directory on the installation machine in which the application should store its data.
To do this requires taking the below steps:
> [!WARNING]
> If you already have data stored somewhere that isn’t your mounted data directory, these steps won’t move the data into the right place. To get help with that problem, contact Gradle support.
#### 1. Patch the K3s Local-Path-Provisioner Configuration
This instructs the local-path-provisioner to store Kubernetes application data within the directory of your choosing.
```shell
cat > local-path-config-patch.yaml << EOF
data:
config.json: |-
{
"nodePathMap":[
{
"node":"DEFAULT_PATH_FOR_NON_LISTED_NODES",
"paths":["/your/storage/directory"](https://docs.gradle.com/develocity/reporting-kit/2.2/1)
}
]
}
EOF
```
1. The directory in which you want the application to store data.
```console
kubectl -n kube-system patch configmap/local-path-config --patch-file local-path-config-patch.yaml (1)
```
1. This applies the config patch.
#### 2. Recreate the K3s Local-Path-Provisioner Pod
This is done by deleting the Pod, which will cause it to be immediately recreated and pick up the configuration change.
```shell
kubectl -n kube-system delete "$(kubectl -n kube-system get pods --selector "app=local-path-provisioner" --output "name")"
```
The Pod should come back up within a few seconds, and now all new provisioned storage in the K3s cluster using the local-path storage class (which is the default) will be stored in the directory you configured in the first step.
### Appendix D: Installing the Develocity Reporting Kit on OpenShift
If you are planning to install the Reporting Kit in an OpenShift cluster, you should configure your installation to [disable Pod security contexts](#security_context).
### Appendix E: Query Result Caching
The Reporting Kit includes a persistent query result cache for the Trino query engine. This cache is enabled by default and is used to store the results of all queries that are executed from within Grafana. Once the results of a query have been cached, subsequent identical queries will return the cached results instead of executing the query again. Cache entries expire by default after 1 day, they’re **not** invalidated when new data is ingested by the Reporting Kit.
> [!NOTE]
> The cache uses the query string as-is as the cache key, so any differences in the query string will result in a cache miss.
#### Disabling the Query Result Cache
In some cases, such as when building alerting rules that depend on real-time data, you may want to use a lower cache retention or even completely disable the cache for a specific query. You can configure the cache retention at the query level by prefixing the query string with a special SQL comment:
```sql
-- trino.cache.retention=5m
SELECT count(id) AS "Build count" FROM build
```
Or, to entirely disable the cache for a specific query:
```sql
-- trino.cache.retention=0
SELECT count(id) AS "Build count" FROM build
```
You can adjust the default cache entry retention period or disable query caching entirely [by configuring your Helm values](#query_results_cache_helm_config).
### Appendix F: Disabling HTTPS Communication Between Reporting Kit Components
The Develocity Reporting Kit uses HTTPS for internal communication by default. All queries reaching Trino must be issued from authenticated sources with valid credentials, such as those preconfigured for the Grafana instance.
The use of HTTPS to communicate between components may be incompatible with some environments, particularly those using a service mesh, such as Istio. In such cases, you can disable HTTPS by setting the Helm value `trino.internal.https.enabled` to `false`.
An example of how to do this is shown below:
**values.yaml:**
```
trino:
internal:
https:
enabled: false
```
> [!WARNING]
> We don’t recommend disabling HTTPS unless you have to, because when HTTPS is disabled, Trino won’t attempt to authenticate query requests, which is insecure.
### Appendix G: Importing Dashboards Into a User-Managed Grafana Instance
The Develocity Reporting Kit supports the use of a user-managed Grafana instance. You can import the Gradle-provided dashboards into your Grafana instance by using a dashboard bundle we provide.
The dashboard bundle contains the following files (after being unzipped):
```
/
├─ README.md (1)
├─ dashboards/ (2)
│ ├─ 00 - Overview/
│ │ ├─ global-volume.json
│ │ ├─ ...
│ ├─ 10 - Environment/
│ │ ├─ build-tools.json
│ │ ├─ ...
│ ├─ ...
├─ example-datasource.yaml (3)
```
1. The README file contains instructions on how to import the dashboards into Grafana.
2. The `dashboards` directory contains all the JSON files for the dashboards. The directories represent Grafana dashboard folders.
3. The `example-datasource.yaml` file is an example Grafana datasource configuration that you can import to set up the Trino datasource in Grafana.
These dashboards can be imported to your instance using [Grafana provisioning](https://grafana.com/tutorials/provision-dashboards-and-data-sources/), or by using the [Grafana API](https://grafana.com/docs/grafana/latest/developer-resources/api-reference/http-api/dashboard/) with a tool of your choice. There’s detailed information about importing our dashboards into a user-managed Grafana instance in our [AWS-based Develocity Reporting and Visualization documentation](https://docs.gradle.com/develocity/reporting-aws/2.1/#import_dashboards).
#### Downloads
* [Dashboard bundle ZIP file](https://docs.gradle.com/downloads/drk-user-managed-grafana-dashboards-release-bundle/drk-user-managed-grafana-dashboards-release-bundle-2.2.1.zip)
* [SHA256 checksum of the dashboard bundle ZIP file](https://docs.gradle.com/downloads/drk-user-managed-grafana-dashboards-release-bundle/drk-user-managed-grafana-dashboards-release-bundle-2.2.1.zip.sha256)
The table in [Develocity Compatibility](https://docs.gradle.com/develocity/2026.1/miscellaneous/compatibility/#develocity_reporting_kit_user_managed_grafana_bundle) shows the compatibility between Develocity Reporting Kit versions and dashboard bundle versions.
For information on which versions of Grafana are compatible with the dashboards we provide, see [Grafana dashboard compatibility](https://docs.gradle.com/develocity/2026.1/miscellaneous/compatibility/#develocity_reporting_and_visualization_grafana).