You are viewing **Develocity IntelliJ Plugin 1.2**. To view the latest available version of the docs, see [1.3](https://docs.gradle.com/develocity/intellij-plugin/1.3/).
# Develocity IntelliJ Plugin User Manual
The [Develocity IntelliJ plugin](https://plugins.jetbrains.com/plugin/27471-develocity) seamlessly integrates Develocity and Build Scan capabilities directly into your IDE.
* It displays a [live build timeline](#live_build_timeline) of task/goal execution and resource usage within your IntelliJ IDE, for all your Gradle and Maven builds.
* It can automatically configure your Gradle build to [publish Build Scans](#build_scan_publication) to gradle.com or your Develocity server.
* It decorates your Java/Kotlin/Groovy test source files with [historical test results](#test_history).
## Features
### Live Build Timeline
_Available for: All Users_
The plugin displays a live timeline of task/goal execution and resource usage within the IntelliJ Run tool window. This helps identify bottlenecks and visualize parallelism.
Run a Gradle or Maven build (e.g., via Run Configuration or Gradle Sync). The timeline appears in the build output window.
Live build timeline
*
Gradle
*
Maven
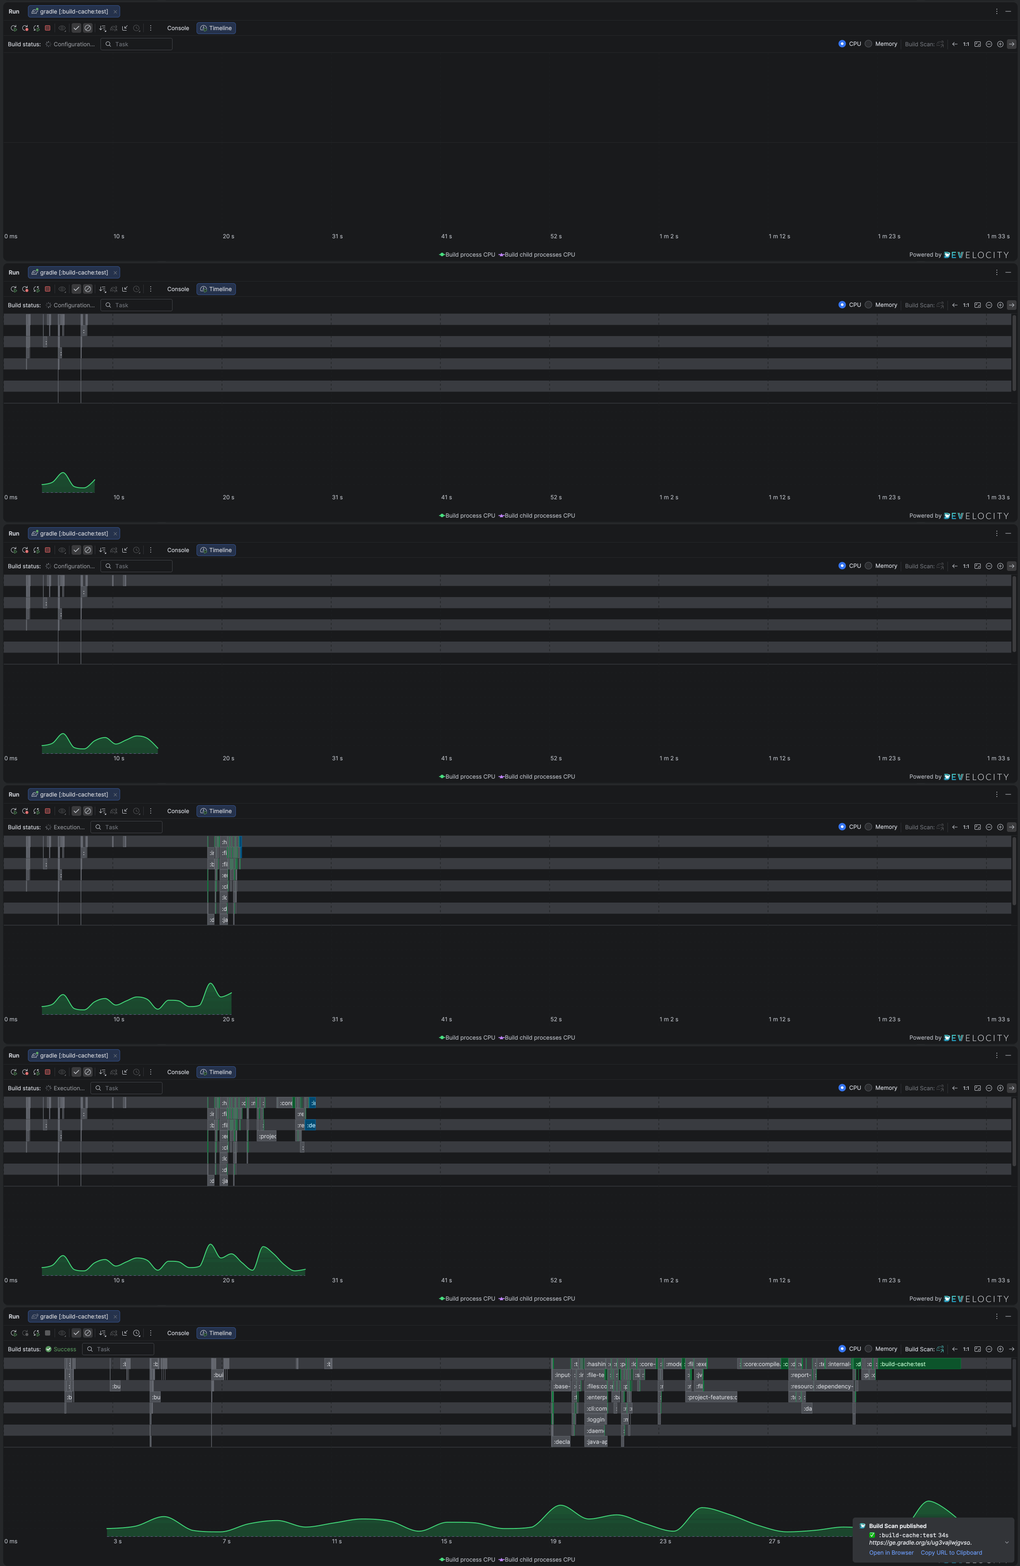
Live build timeline
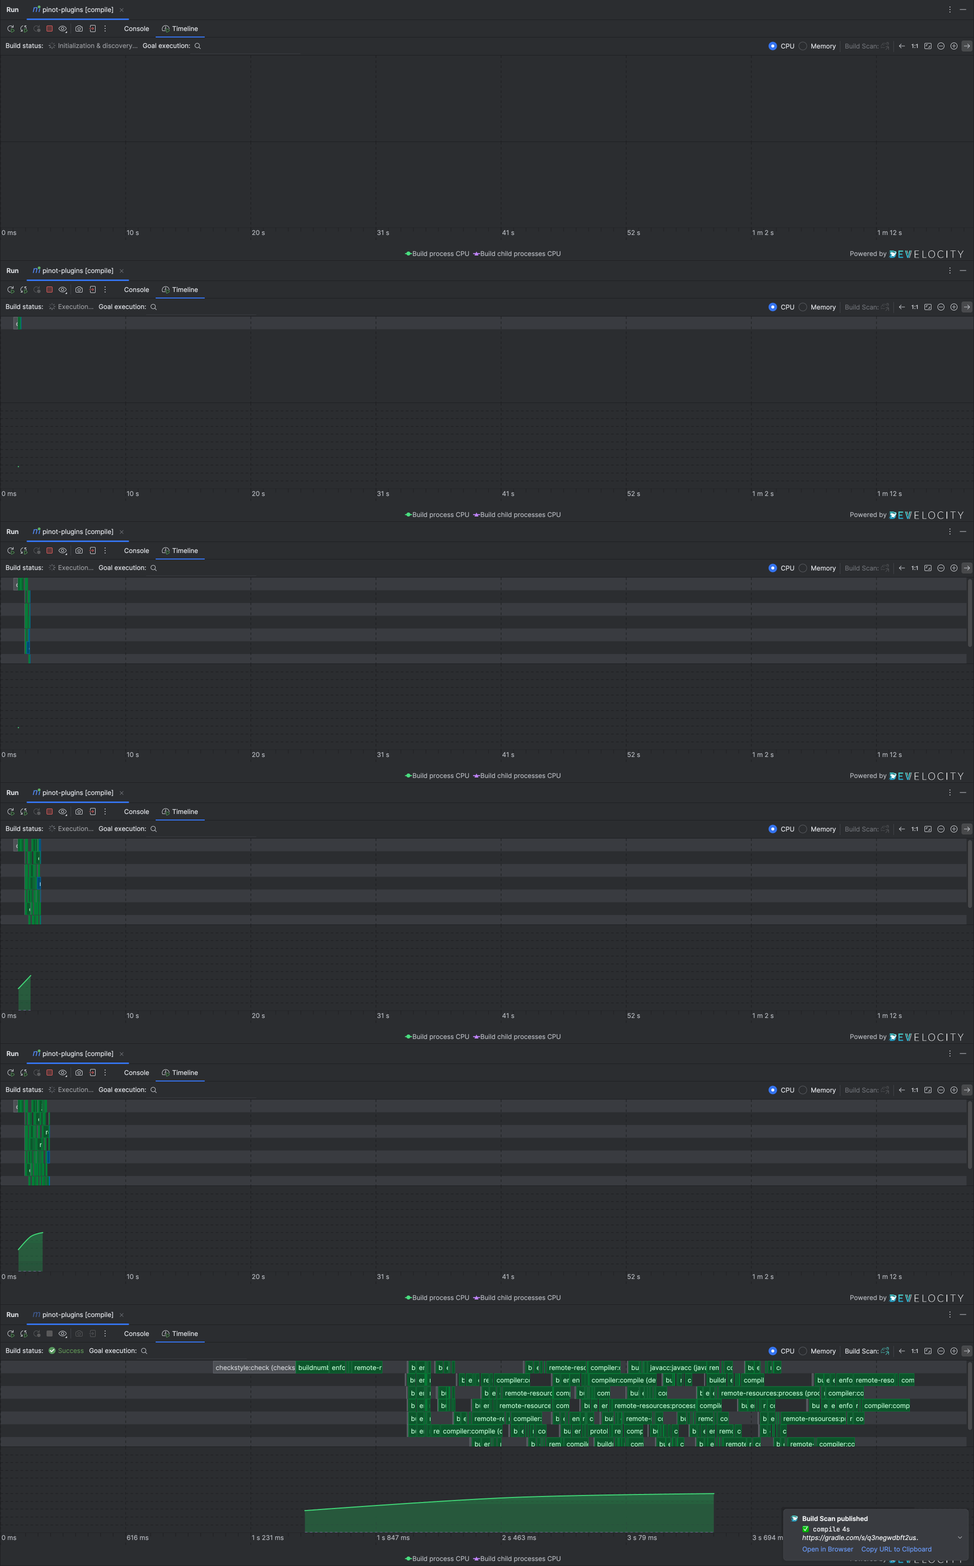
Live build timeline
> [!TIP]
> Hover over blocks to see task/goal duration and type.
> [!TIP]
> CPU and Memory resource usage is visible while the build runs.
### Build Scan Publication
_Available for: Users publishing to gradle.com or users with a Develocity server_
The plugin can automatically configure your Gradle build to publish Build Scans to gradle.com or your Develocity server.
When a Build Scan is published, a notification with a link to the Build Scan appears in the IDE, and you can also access the Build Scan from the timeline toolbar and task/goal details.
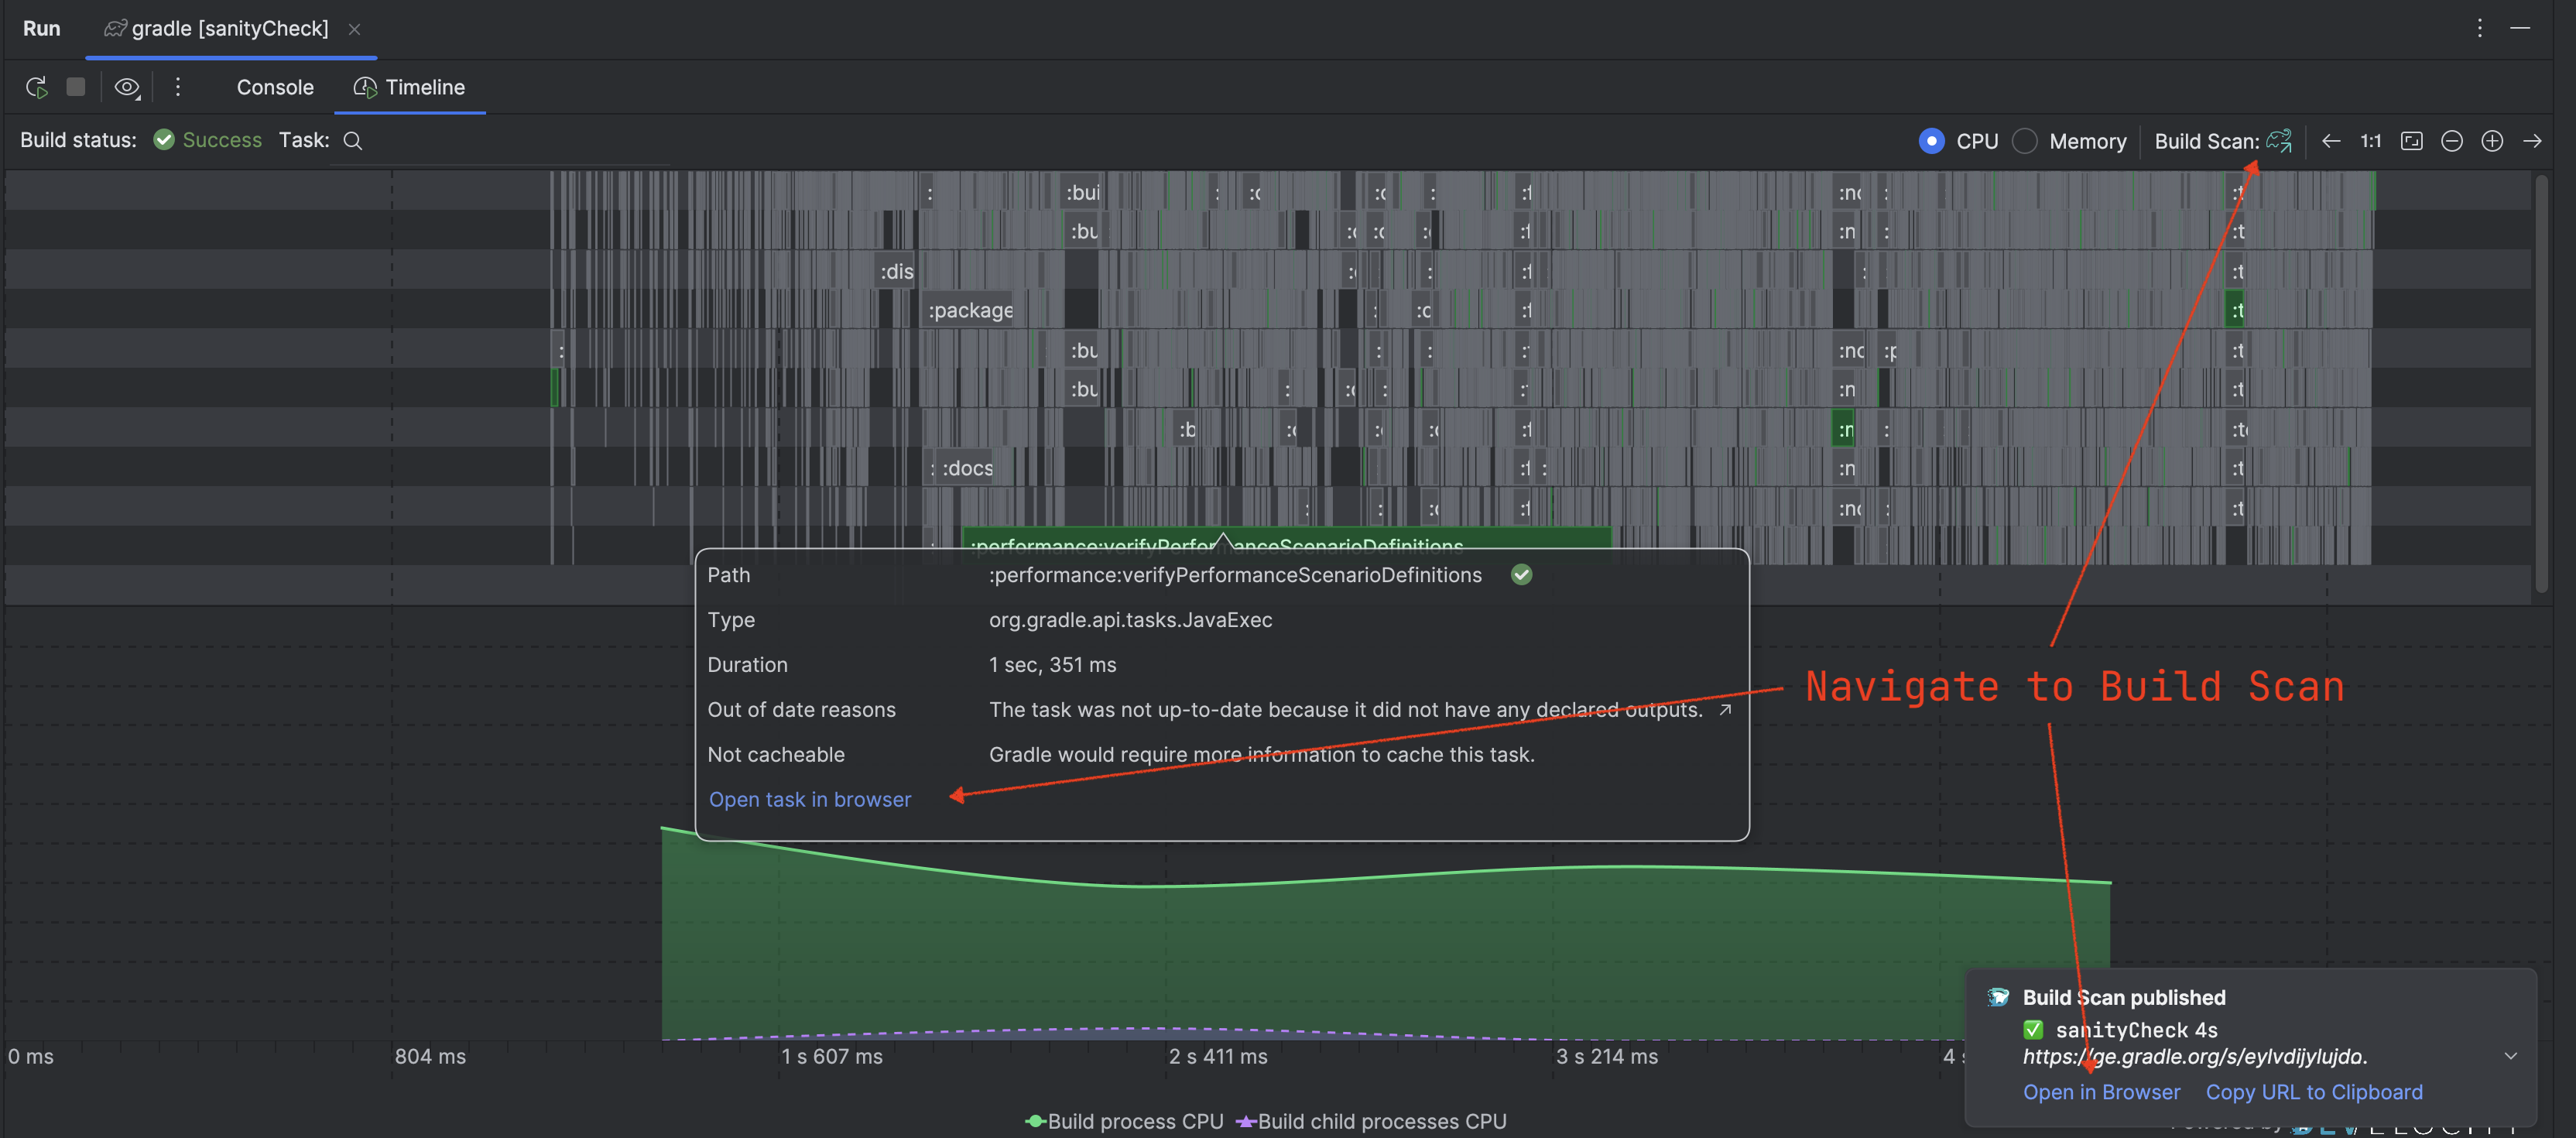
Accessing the published Build Scan
> [!NOTE]
> To learn more about Build Scans, see [https://scans.gradle.com](https://scans.gradle.com).
### Test History
_Available for: Users connected to a Develocity Server with the Test Analytics feature enabled_
When connected to a Develocity server, the plugin decorates your Java/Kotlin/Groovy test source files with historical results. All Build Scans published to your Develocity server (i.e. from you or other local users, and from CI agents) contribute to this analysis.
Test class and test methods are decorated with inlays showing recent pass/fail/flakiness history.
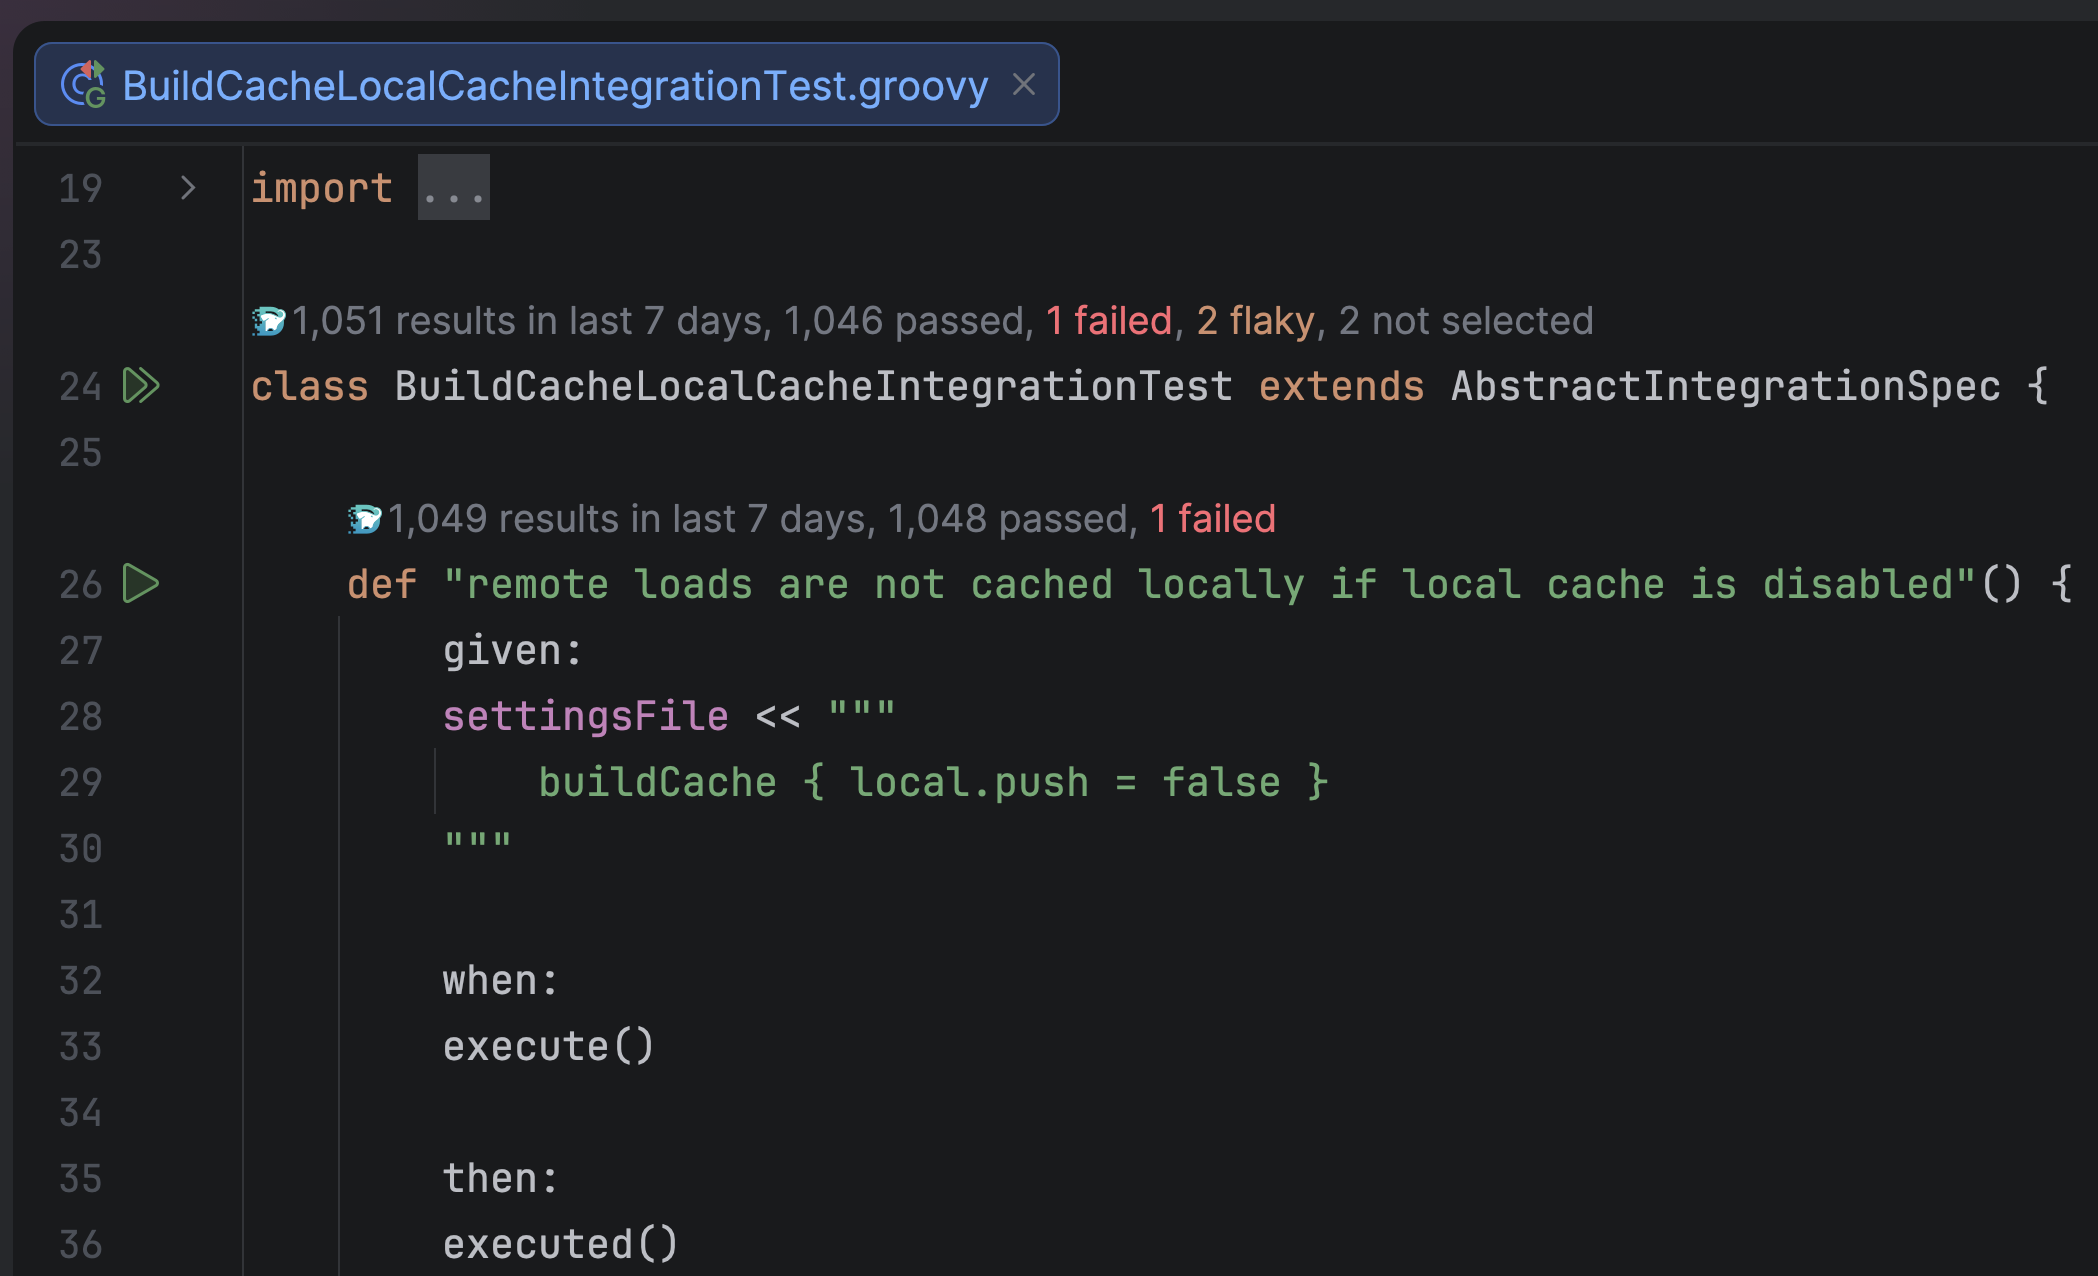
Test history
> [!NOTE]
> Test history requires permission to access the Develocity Test API. The provided access key must have the [`Access build data via the API` permission](https://docs.gradle.com/develocity/2026.1/administration/access-control/permissions-and-roles/#permissions).
> [!TIP]
> Test history can be configured via the settings to work with data from the past day, or the past 7 days.
## Installation
* Open IntelliJ IDEA.
* Go to **File** **Settings** (or **IntelliJ IDEA** **Settings** on macOS).
* Navigate to **Plugins**.
* Select the **Marketplace** tab.
* Search for "Develocity".
* Click **Install** next to the "Develocity" plugin and restart your IDE when prompted.
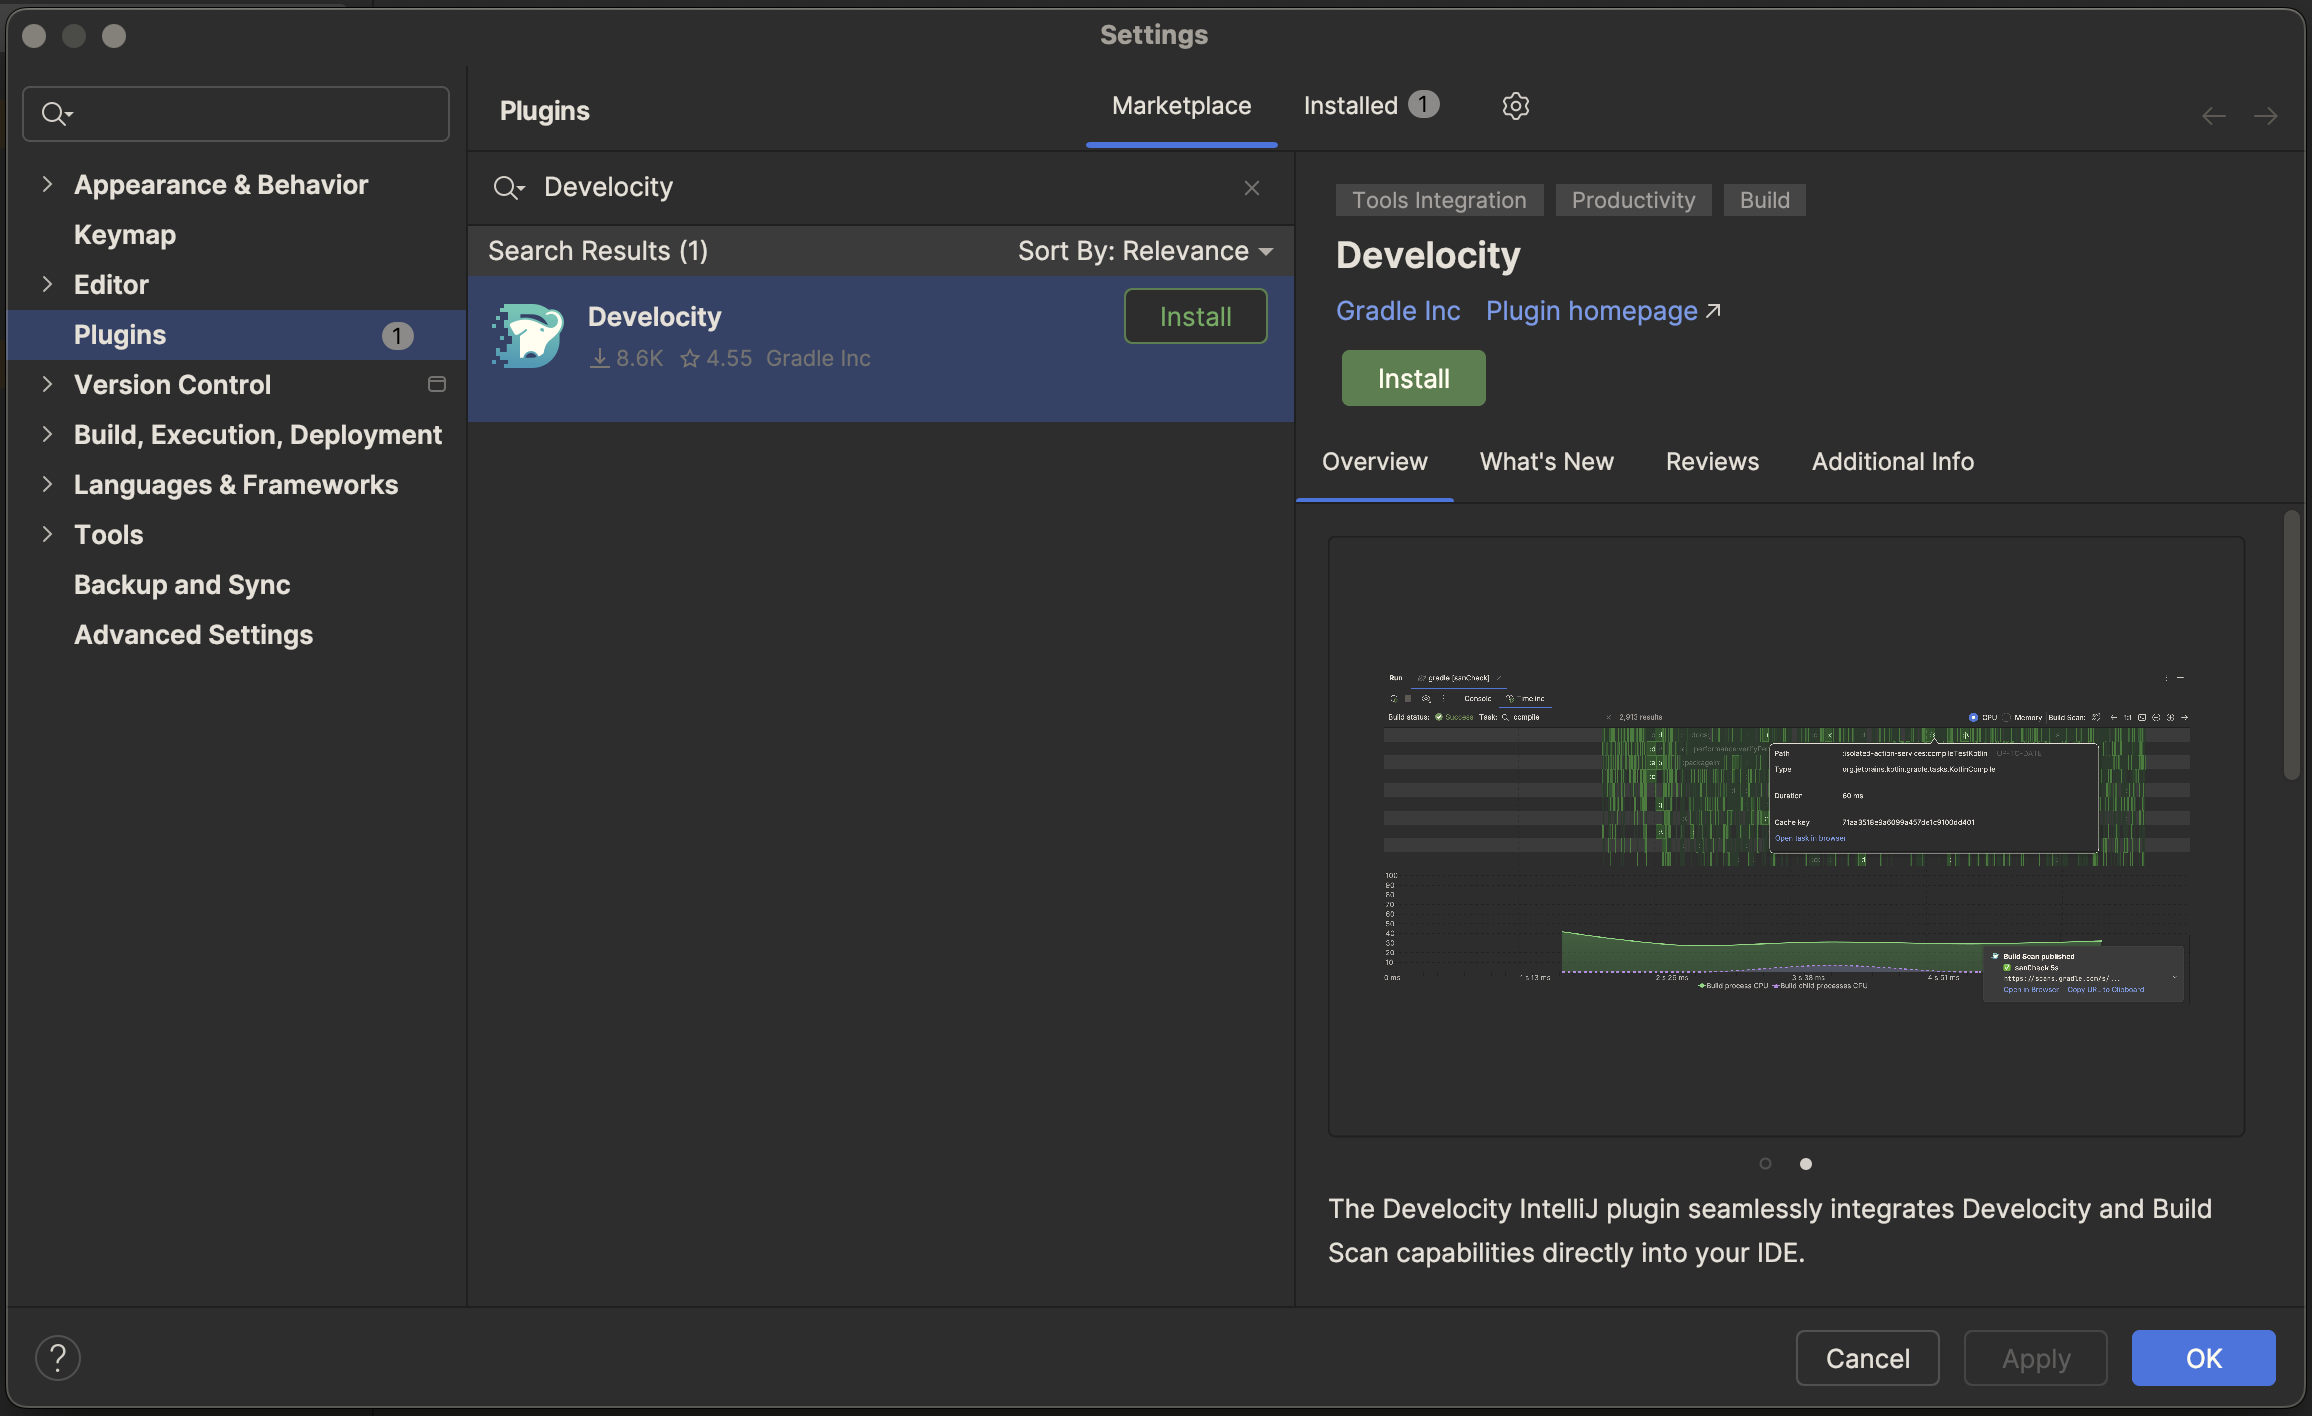
Plugin Installation
## Getting Started
Choose the setup path that best matches your environment.
### Path A: Standalone (Local)
_For users who want local build insights without connecting to a Develocity server._
You can benefit from the [live build timeline](#live_build_timeline) feature:
1. Open the settings via **File** **Settings** **Tools** **Develocity** (or **IntelliJ IDEA** **Settings** **Tools** **Develocity** on macOS).
2. Set **Develocity Connection** to `None`.
3. Ensure the `Live build timeline` feature is selected.
4. To see the live build timeline, your build needs to be configured:
* **Gradle:** Select the `Configure the build` and `Apply Develocity Gradle plugin` checkboxes to configure it automatically.
* **Maven:** You must manually add the Develocity Maven extension. See the [Develocity Maven Extension User Manual](https://docs.gradle.com/develocity/maven/2.4/maven-extension/#manual-setup).
⇒ Your next build will now show a live timeline while executing.
Live build timeline
*
Gradle
*
Maven

Live build timeline

Live build timeline
### Path B: Connected (gradle.com)
_For users who want deep build insights using the free Build Scan service._
In addition to the [live build timeline](#live_build_timeline) mentioned above, you can decide to [publish a free Build Scan](#build_scan_publication) to gradle.com for deeper insights into your build.
> [!NOTE]
> To learn more about Build Scans, see [https://scans.gradle.com](https://scans.gradle.com).
To publish Build Scans to gradle.com:
1. Open the settings via **File** **Settings** **Tools** **Develocity** (or **IntelliJ IDEA** **Settings** **Tools** **Develocity** on macOS).
2. Set **Develocity Connection** to `Develocity at gradle.com`.
3. Configure your build to accept the [Gradle Terms of Use](https://gradle.com/legal/terms-of-use/):
* **Gradle:** Select the `Configure the build` and `I agree to the Gradle Terms of Use` checkboxes.
* **Maven:** You must manually add the Develocity Maven extension and accept the Terms of Use. See the [Develocity Maven Extension User Manual](https://docs.gradle.com/develocity/maven/2.4/maven-extension/#accept-the-scans-gradle-com-terms-of-use).
⇒ Your next build will now publish a Build Scan to gradle.com when it completes, and a notification with a link to the Build Scan will appear in the IDE.

Accessing the published Build Scan
### Path C: Connecting with a Develocity Server
_For users with access to a Develocity server._
If your organization uses Develocity, connecting the plugin unlocks [historical test results](#test_history), in addition to the [live build timeline](#live_build_timeline) and [automatic Build Scan publishing](#build_scan_publication) features mentioned above.
1. Open the settings via **File** **Settings** **Tools** **Develocity** (or **IntelliJ IDEA** **Settings…** on macOS).
2. Set **Develocity Connection** to `Develocity server`.
3. Enter your **Develocity Server URL**.
4. Authenticate with your credentials, if needed:
* Click the **Log in…** button.
* Authentication can be auto-discovered based on existing configuration files on your machine, or a known access key can be provided or generated via your browser.
* _Authentication is required to access Test History features._
5. Ensure the `Test history in source files` feature is selected.
⇒ Test history will be available in your Java/Kotlin/Groovy test source files.

Test history
## Configuration Reference
Configuration is managed via **File** **Settings** **Tools** **Develocity** (or **IntelliJ IDEA** **Settings** **Tools** **Develocity** on macOS).
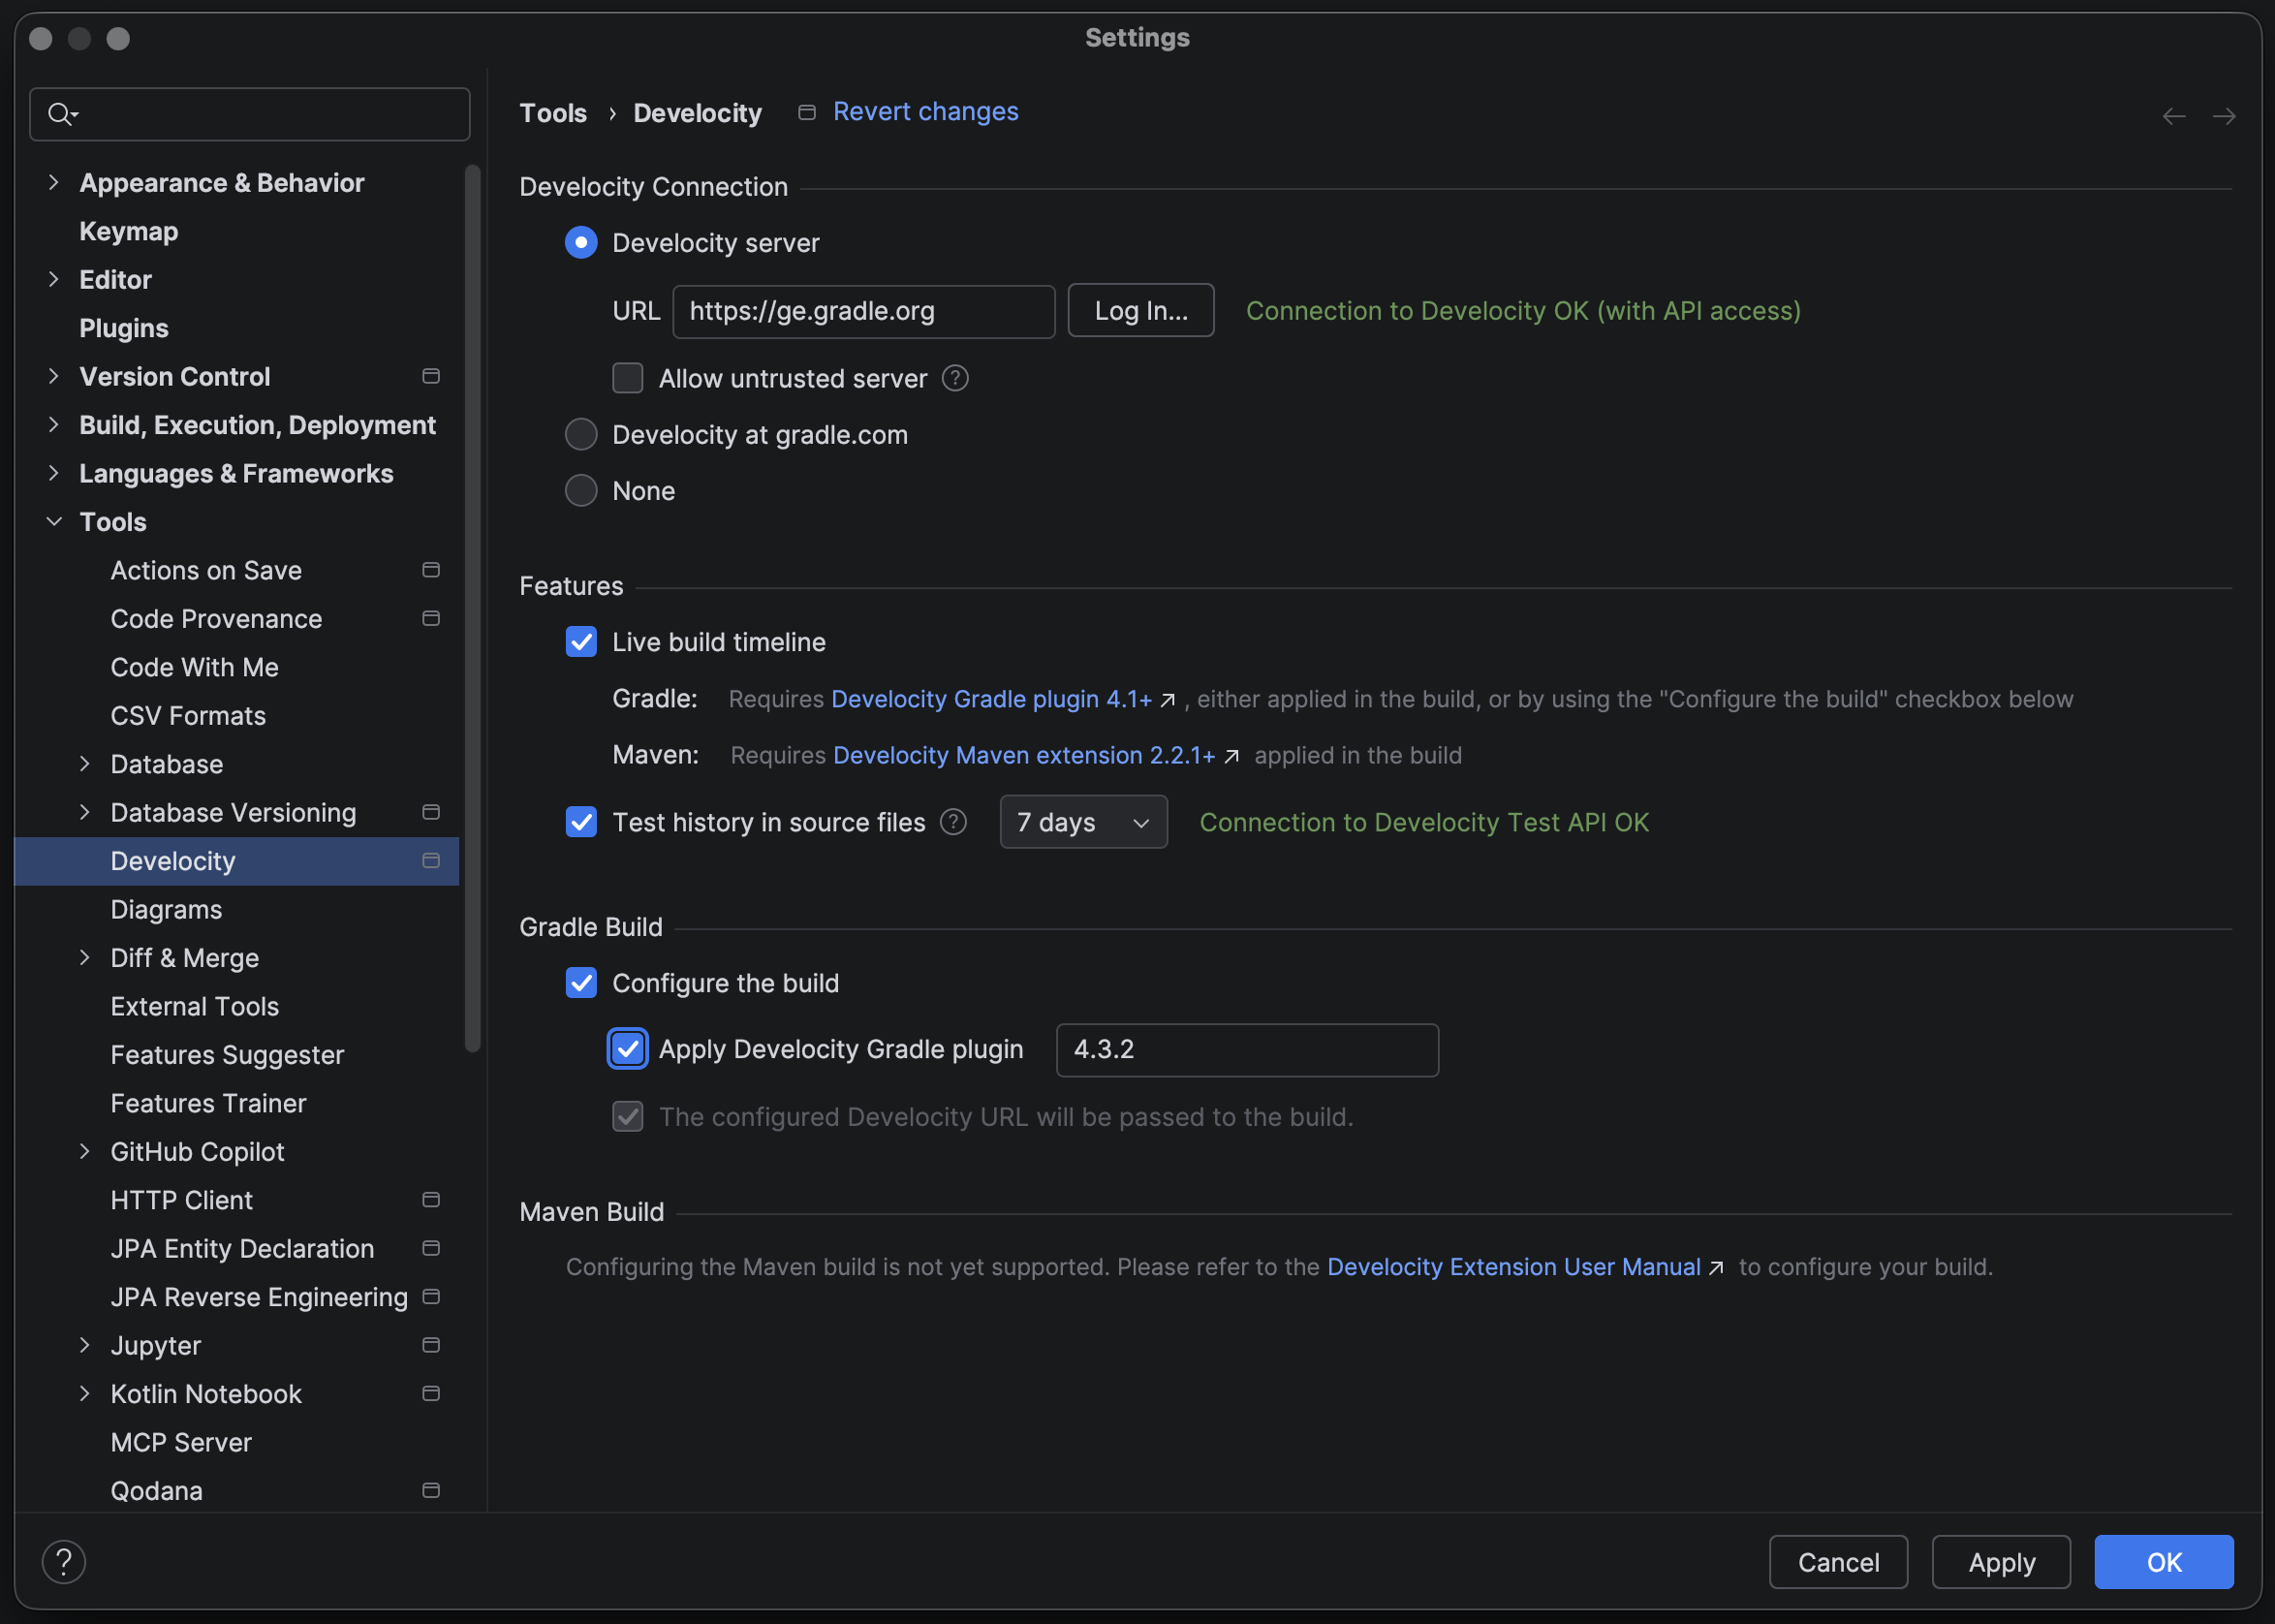
Develocity Configuration
| Develocity Connection | Description |
| --- | --- |
| Develocity Server | Select this option when connecting to a Develocity server (e.g. your organization’s Develocity server). URL: Specify the URL of your Develocity server (e.g., https://develocity.example.com). Log in…: Specify the access key to be used to authenticate with the Develocity server. Required for the Test History feature. Allow untrusted server: Enables connecting to Develocity servers with self-signed or untrusted SSL certificates. |
| Develocity at gradle.com | Select this option when connecting to the free Develocity service at gradle.com. |
| None | Select this option when not connecting to any Develocity server (local-only usage). |
| Features | Description |
| --- | --- |
| Live build timeline | Enables the live build timeline feature for Gradle and Maven builds executed within IntelliJ. Requires the Develocity Gradle plugin (4.1+) or Develocity Maven extension (2.2.1+). For Gradle builds, the Develocity Gradle plugin can be auto-applied to your build. |
| Test history in source files | Enables test history in Java/Kotlin/Groovy test source files. Requires connection to a Develocity server with the Test Analytics feature enabled. A time range for the test history data can be specified (past day or past 7 days). |
| Gradle build | Description |
| --- | --- |
| Configure the build | Automatically configures your Gradle build without modifying its Gradle files. Apply Develocity Gradle plugin: Specify the Develocity Gradle plugin to be used. When configured, the Develocity server URL is also passed to the build and will take precedence over any in-build configuration. |
| Maven build | Description |
| --- | --- |
| Configure the build | Automatically configuring your Maven build is currently not supported. You will need to manually add the Develocity Maven extension to your build. See the Develocity Maven Extension User Manual for instructions. |
## Troubleshooting
### Live Build Timeline Shows No Data
**Symptom** — The timeline view displays a message like "Something went wrong and no data was received from the build."
**Cause** — The Develocity IntelliJ plugin isn’t receiving data from the Develocity Gradle plugin / Develocity Maven extension. This typically happens if the Gradle plugin / Maven extension version applied to your build is older than the minimum required version.
**Solution** — Ensure your build applies Develocity Gradle plugin 4.1 or newer, or Develocity Maven extension 2.2.1 or newer.
### Some of My Maven Builds Aren’t Shown in the Live Build Timeline
**Symptom** — The timeline view isn’t displayed for some Maven builds.
**Cause** — The build isn’t delegating to Maven, but uses the internal IDE build mechanism. For instance Maven sync/reload aren’t delegating to Maven, or the IDE can be configured to run tests without delegating to Maven.
**Solution** — Configure your IDE to delegate the build/test actions to Maven, or don’t expect the timeline view to be shown for such builds.
### Live Build Timeline Is Affecting the Performance of My Machine
**Symptom** — CPU usage spikes when the timeline view is visible.
**Cause** — The timeline view might repaint too frequently for the capabilities of your machine.
**Solution** — Go to **Help** **Find Action**, type `Registry` and press Enter to open the IDE registry. Then look for the key `com.gradle.develocity.ide.timeline.refresh.millis`. You can specify any value between 10ms and 5000ms. Try a bigger value to reduce the performance impact of the timeline view.
### Connection to Develocity Server Fails
**Symptom** — The settings page displays a message like "Connection to Develocity failed".
**Cause** — The Develocity server URL is incorrect, or there is a network issue preventing the connection.
**Solution** — Verify the Develocity server URL is correct, and that your machine can reach the server.
### Connection to Develocity Server Indicates "no API access"
**Symptom** — The settings page displays a message like "Connection to Develocity OK (without API access)".
**Cause** — No access key was automatically discovered or provided.
**Solution** — Click the **Log in…** button and provide a valid access key with the `Access build data via the API` permission.
### Connection to Develocity Test API Fails
**Symptom** — The settings page displays a message like "Connection to Develocity Test API failed".
**Cause** — The provided access key doesn’t have the `Access build data via the API` permission, or the Develocity server doesn’t have the Test Analytics feature enabled.
**Solution** — Provide an access key with the `Access build data via the API` permission, or contact your Develocity server administrator to enable the Test Analytics feature.